Fig. 3
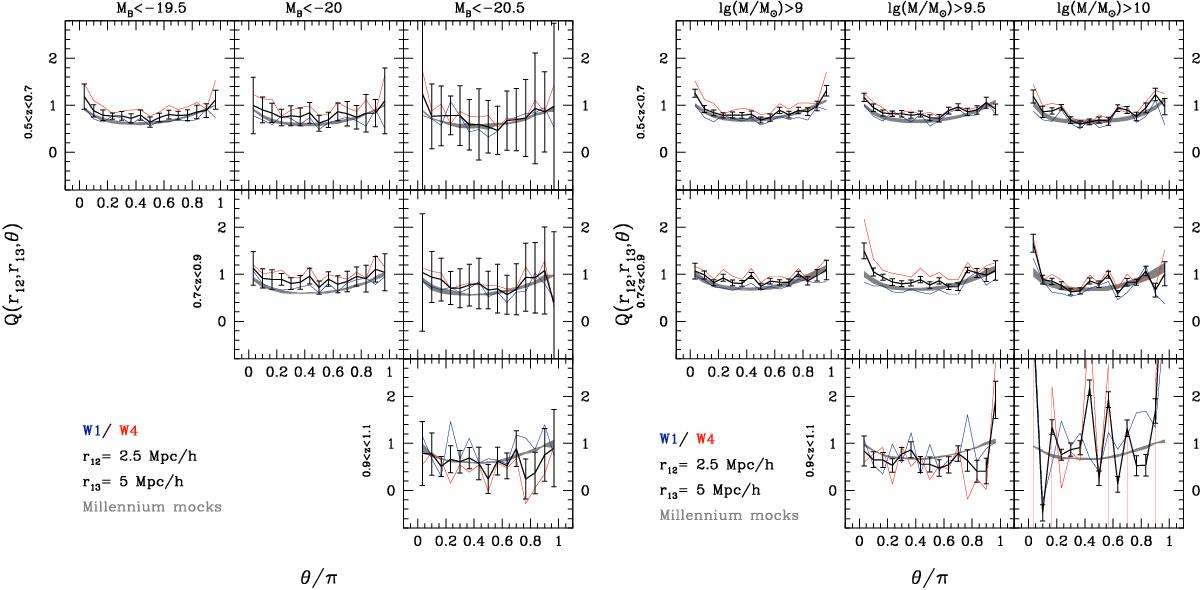
Redshift-space reduced 3PCF, Q(θ), as a function of redshift (panels from top to bottom) for different luminosity (left plots) and stellar mass thresholds (right plots), for scales r12 = 2.5h-1 Mpc and r13 = 5h-1 Mpc . Blue and red lines show the measurements in the W1 and W4 fields, respectively, while the black lines show the combined 3PCF, with its associated errors. The grey shaded area shows the redshift-space 3PCF measured in two large Millennium mock catalogues, constructed to mimic the properties of VIPERS data, and is not representative of the expected scatter in the data.
Current usage metrics show cumulative count of Article Views (full-text article views including HTML views, PDF and ePub downloads, according to the available data) and Abstracts Views on Vision4Press platform.
Data correspond to usage on the plateform after 2015. The current usage metrics is available 48-96 hours after online publication and is updated daily on week days.
Initial download of the metrics may take a while.