Fig. 1
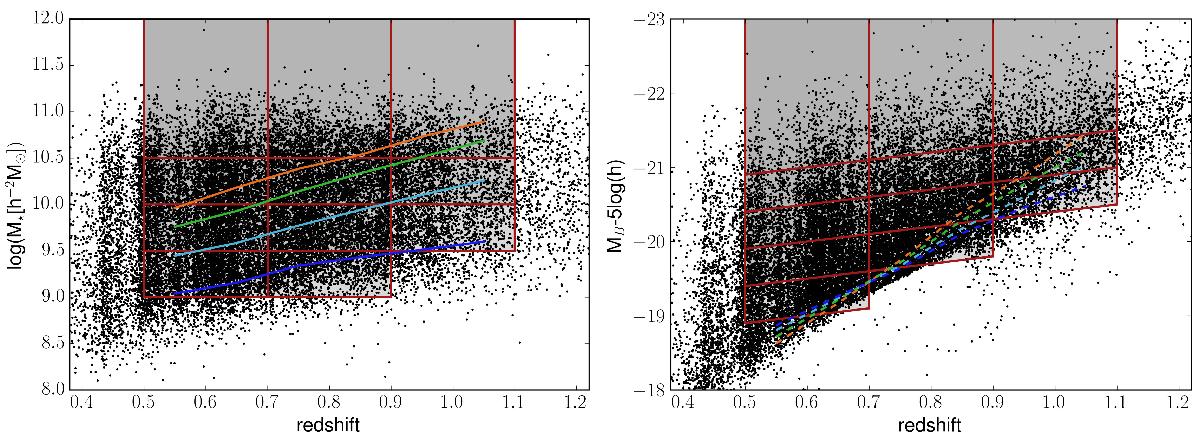
Luminosity- and stellar mass-redshift relations. The black points represent VIPERS galaxies, where red boxes show the selected subsamples. The boxes in MB absolute magnitude are constructed to follow the redshift evolution of galaxies, as discussed in the text. Coloured lines represent the 90% completeness limits for different sub-populations: orange lines for early-type galaxies, green for early-spirals, cyan for late spirals, and blue for irregulars and starbursts, respectively.
Current usage metrics show cumulative count of Article Views (full-text article views including HTML views, PDF and ePub downloads, according to the available data) and Abstracts Views on Vision4Press platform.
Data correspond to usage on the plateform after 2015. The current usage metrics is available 48-96 hours after online publication and is updated daily on week days.
Initial download of the metrics may take a while.