Fig. 1
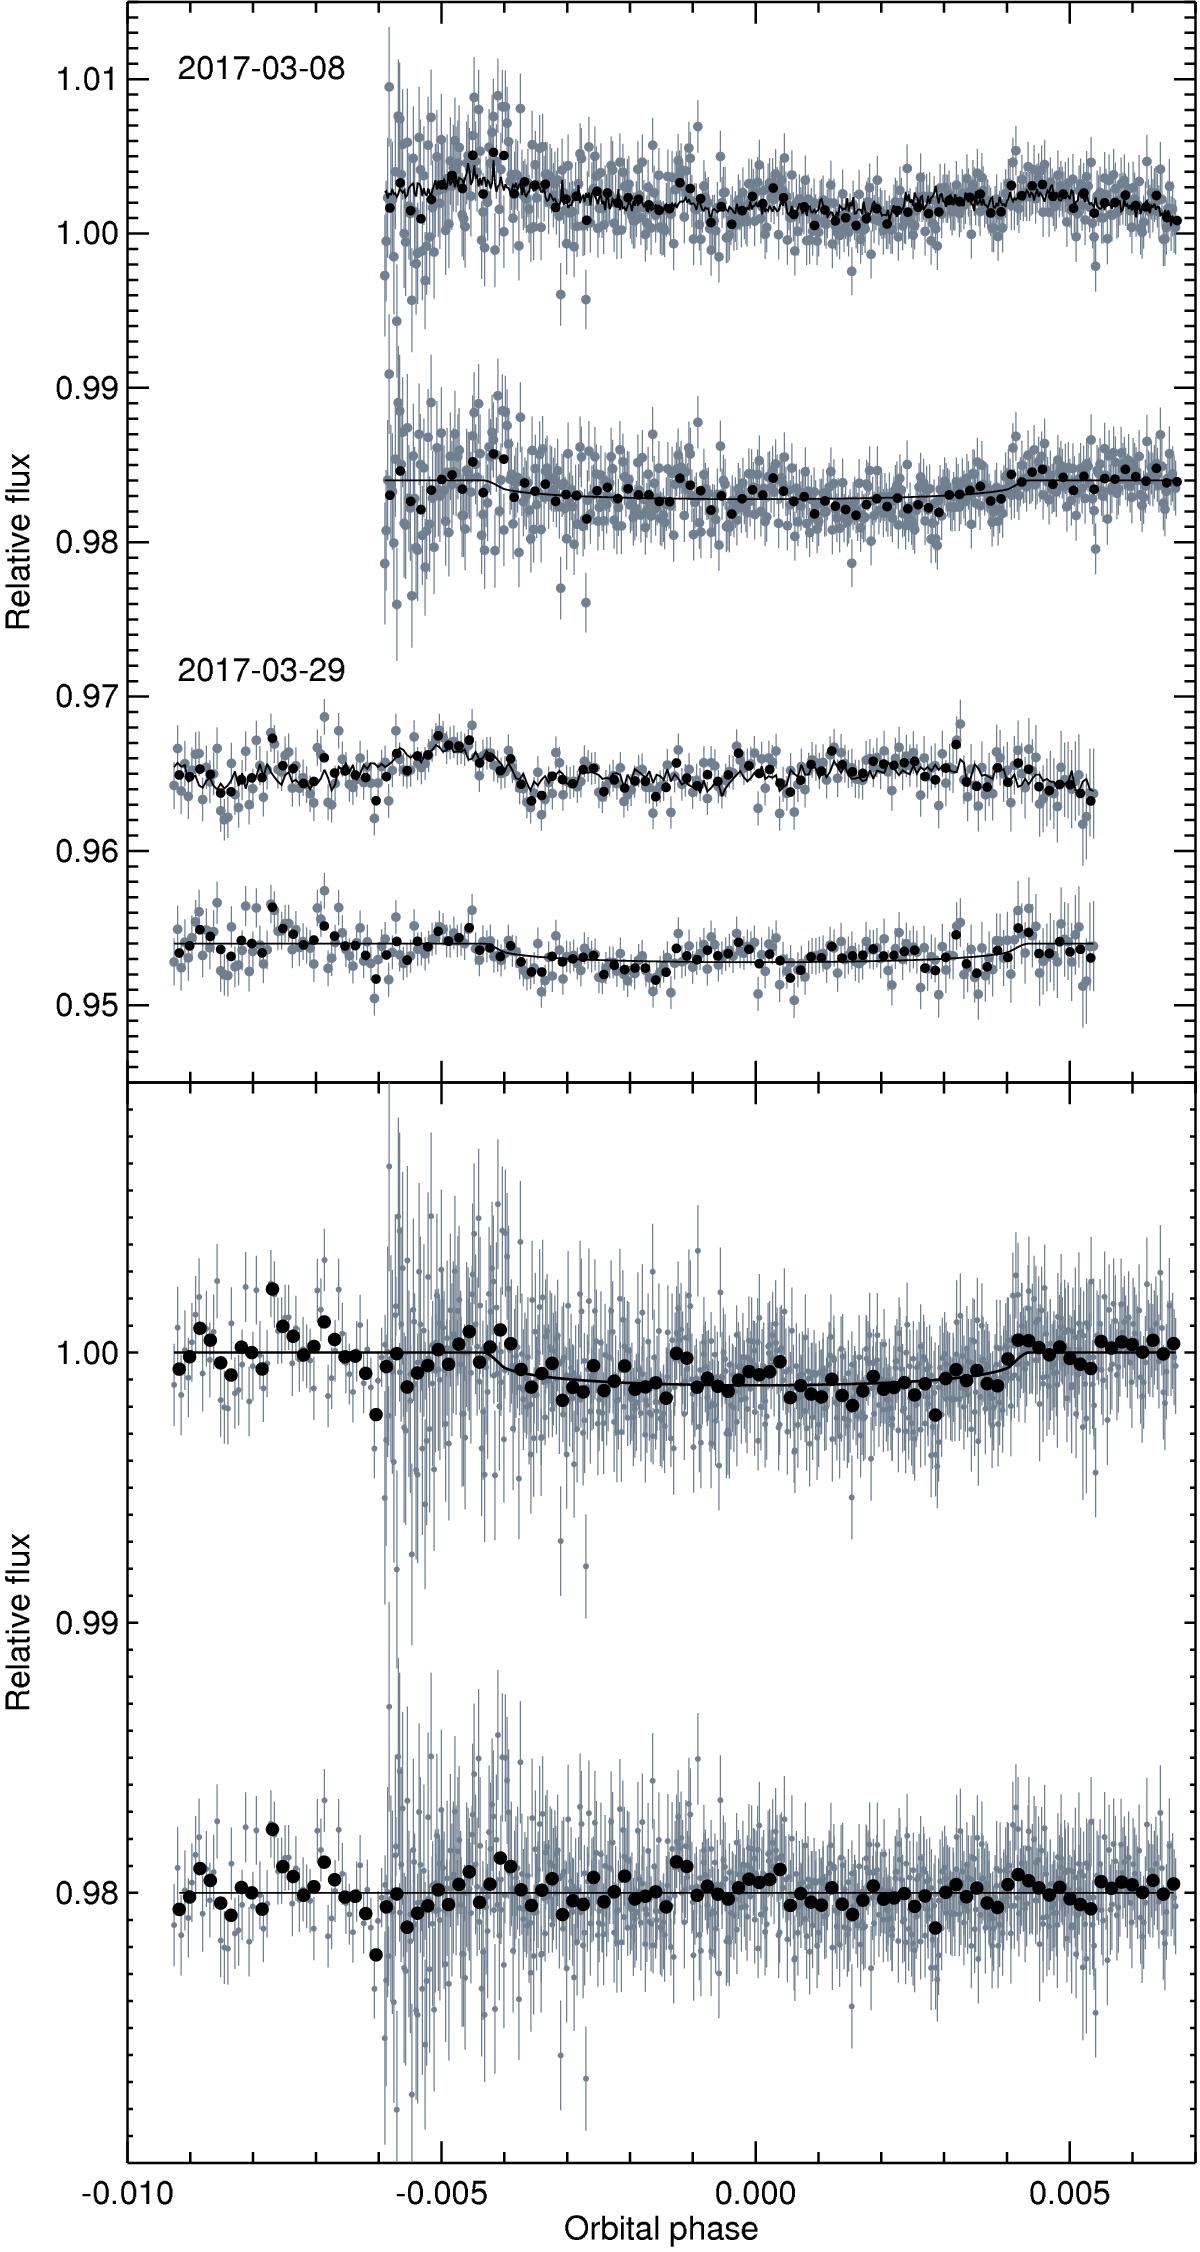
EulerCam observations of HD 106315c. Top: raw light curves, together with their full (transit and baseline) photometric model. For each date, the uncorrected light curves are shown on top, and the light curves corrected for the photometric baseline model are shown below. Bottom: phase folded baseline-corrected data and residuals. Unbinned data are shown in gray, and the same data binned per 5 min are shown in black.
Current usage metrics show cumulative count of Article Views (full-text article views including HTML views, PDF and ePub downloads, according to the available data) and Abstracts Views on Vision4Press platform.
Data correspond to usage on the plateform after 2015. The current usage metrics is available 48-96 hours after online publication and is updated daily on week days.
Initial download of the metrics may take a while.