Fig. A.1
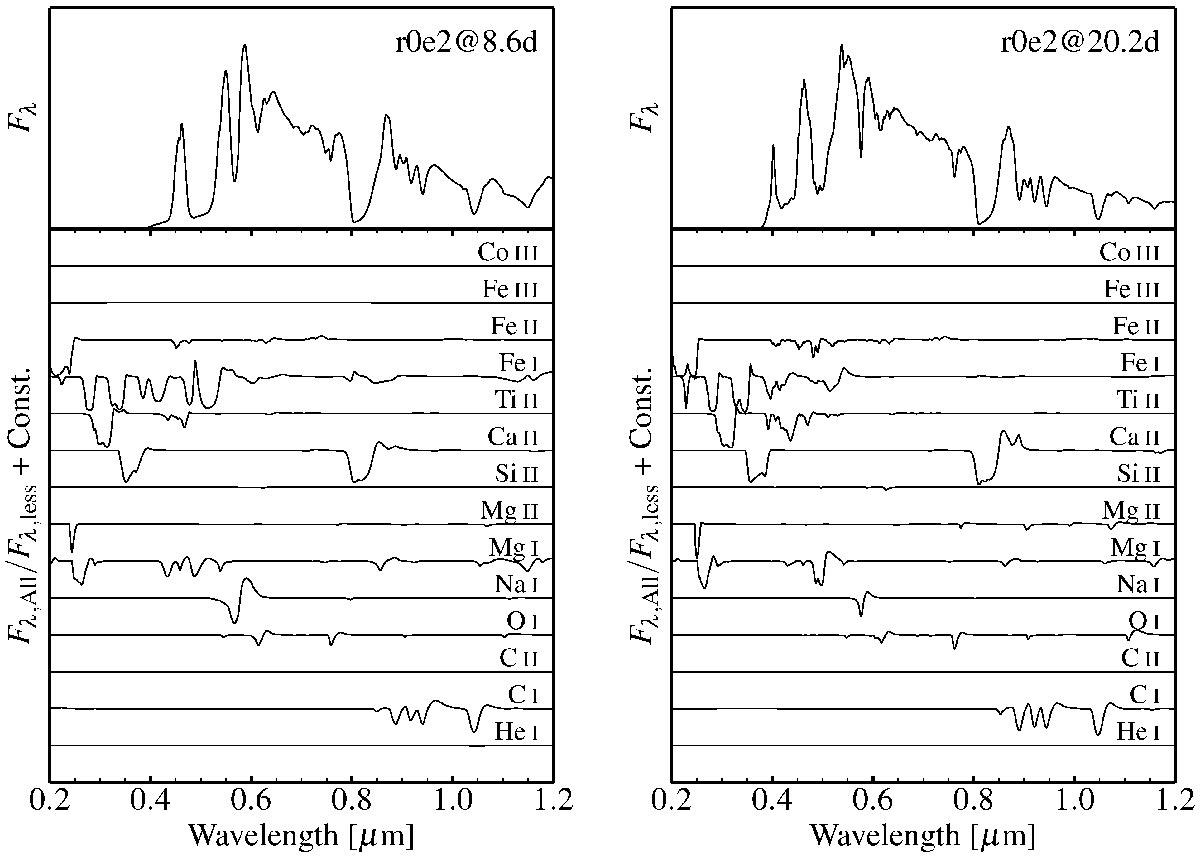
Montage of spectra for model r0e2 for post-explosion times of 8.6 (left) and 20.2 d (right). In the top part of each panel, we show the total spectrum, while below, we stack the ratio between the full synthetic spectrum (Fλ,All) and the synthetic spectrum computed by ignoring the bound-bound transitions of a given ion (Fλ,less; as indicated by the label on the right).
Current usage metrics show cumulative count of Article Views (full-text article views including HTML views, PDF and ePub downloads, according to the available data) and Abstracts Views on Vision4Press platform.
Data correspond to usage on the plateform after 2015. The current usage metrics is available 48-96 hours after online publication and is updated daily on week days.
Initial download of the metrics may take a while.