Fig. 4
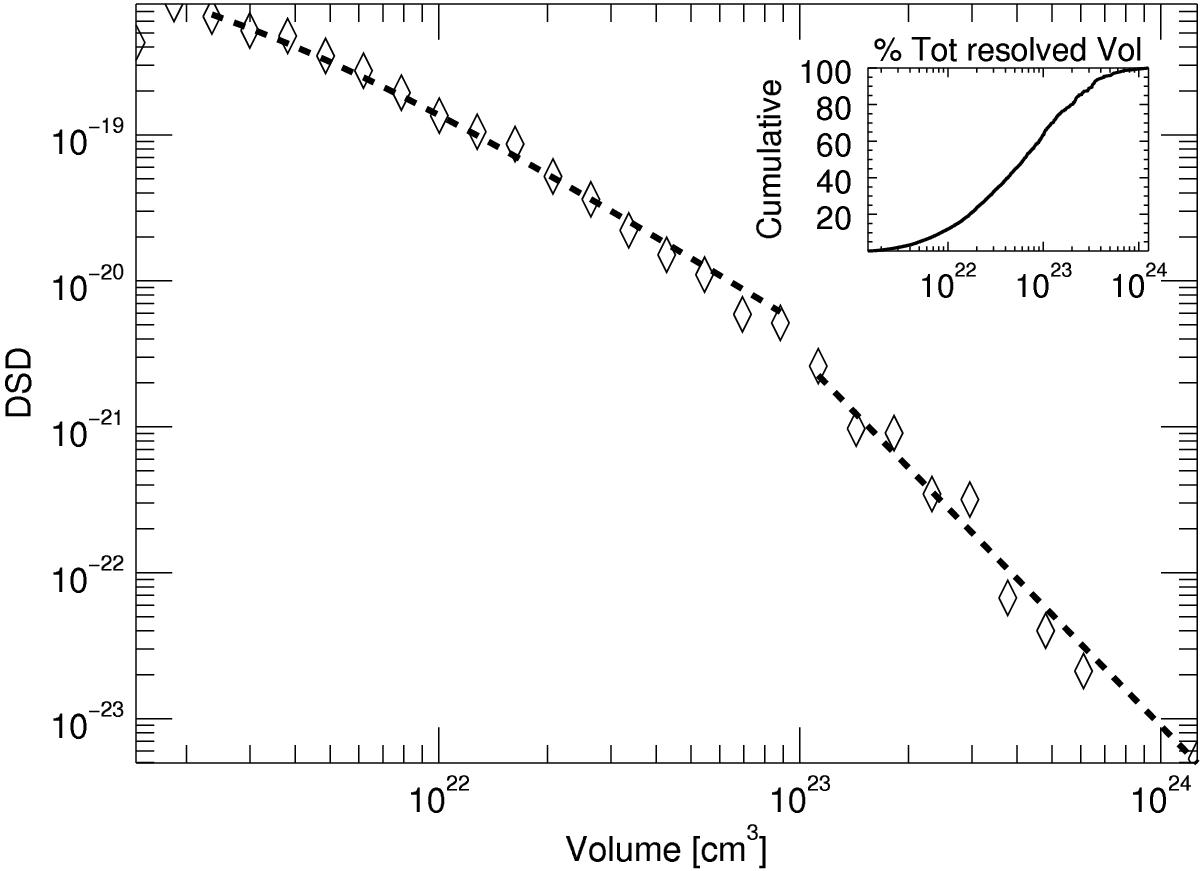
Differential size distribution of the identified features’ volume in logarithmic scale. Two powerlaws are fitted to the data, which have slopes equal to α = 1.53 ± 0.03 with a goodness-of-fit χ2 = 3.43 and α = 2.53 ± 0.22 with a goodness-of-fit χ2 = 1.28. The first slope is fitted over 3542 data points in the range between 1.85 × 10²¹ and 1023 cm3, whereas the second over 137 data points in the range between 1022 and 1024 cm3. In the right corner the cumulative of the resolved volume is plotted, that is, N( <x) = f(x).
Current usage metrics show cumulative count of Article Views (full-text article views including HTML views, PDF and ePub downloads, according to the available data) and Abstracts Views on Vision4Press platform.
Data correspond to usage on the plateform after 2015. The current usage metrics is available 48-96 hours after online publication and is updated daily on week days.
Initial download of the metrics may take a while.