Fig. 1
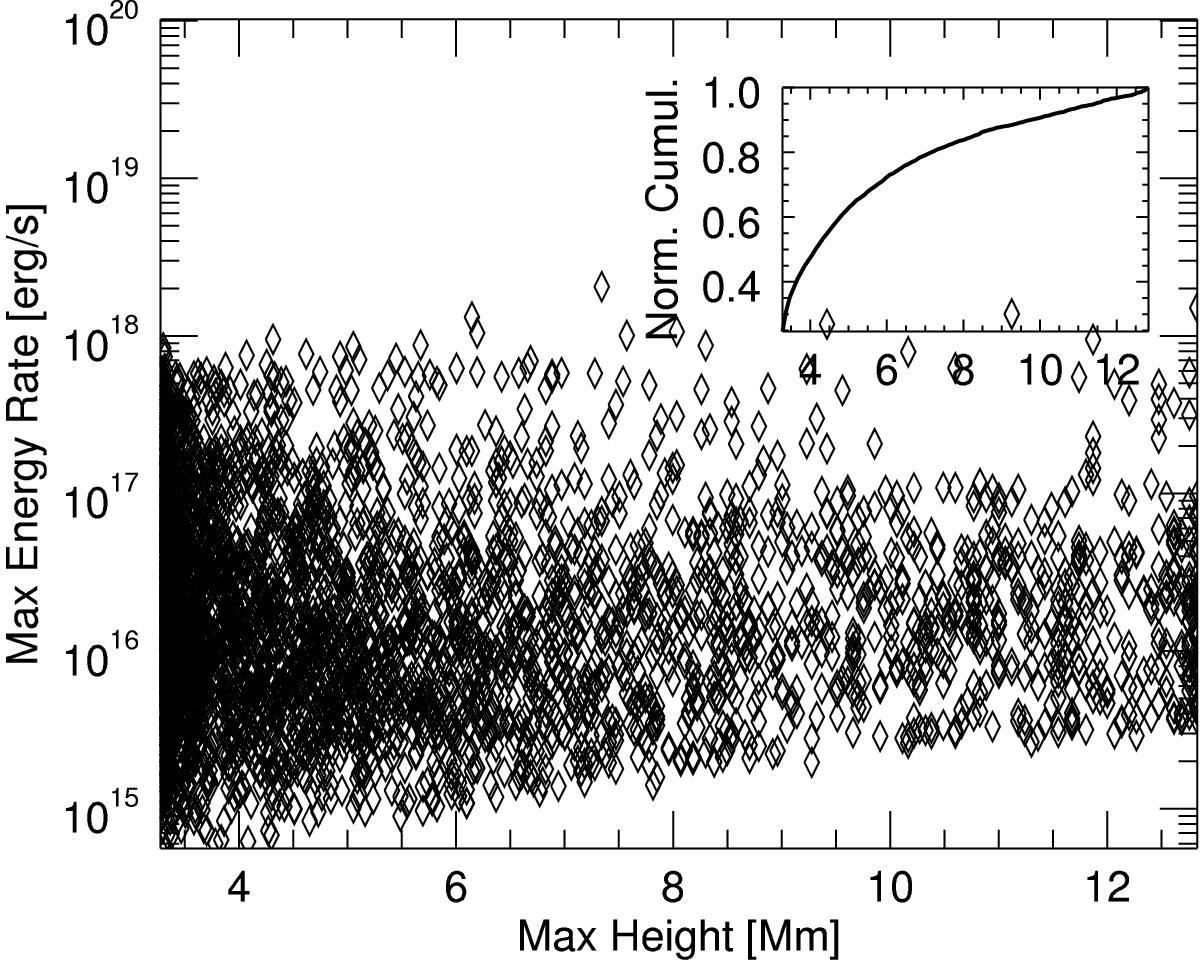
Height of max energy rate for each identified feature with respect to the value of the maximum energy rate plotted in logarithmic scale; this height may be correlated with the height of event initiation. It is clear that the activity in the lower corona is higher than in the rest region. From the normalized cumulative plot we observe the same result: the biggest percentage of data points lays at the lower corona.
Current usage metrics show cumulative count of Article Views (full-text article views including HTML views, PDF and ePub downloads, according to the available data) and Abstracts Views on Vision4Press platform.
Data correspond to usage on the plateform after 2015. The current usage metrics is available 48-96 hours after online publication and is updated daily on week days.
Initial download of the metrics may take a while.