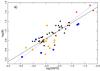
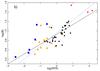
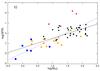
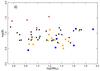
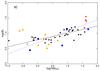
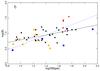
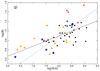
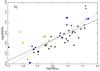
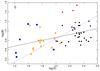
Fig. 2

Relations between various galaxy parameters for sample galaxies of different categories: dwarfs – rectangles, Magellanic and peculiar low-mass galaxies – triangles, spiral galaxies – circles, massive starbursts and LIRGs – diamonds. The solid line represents the M-estimation of Y/X regression and the dashed line denotes the bisector fit.
Current usage metrics show cumulative count of Article Views (full-text article views including HTML views, PDF and ePub downloads, according to the available data) and Abstracts Views on Vision4Press platform.
Data correspond to usage on the plateform after 2015. The current usage metrics is available 48-96 hours after online publication and is updated daily on week days.
Initial download of the metrics may take a while.