Fig. 1
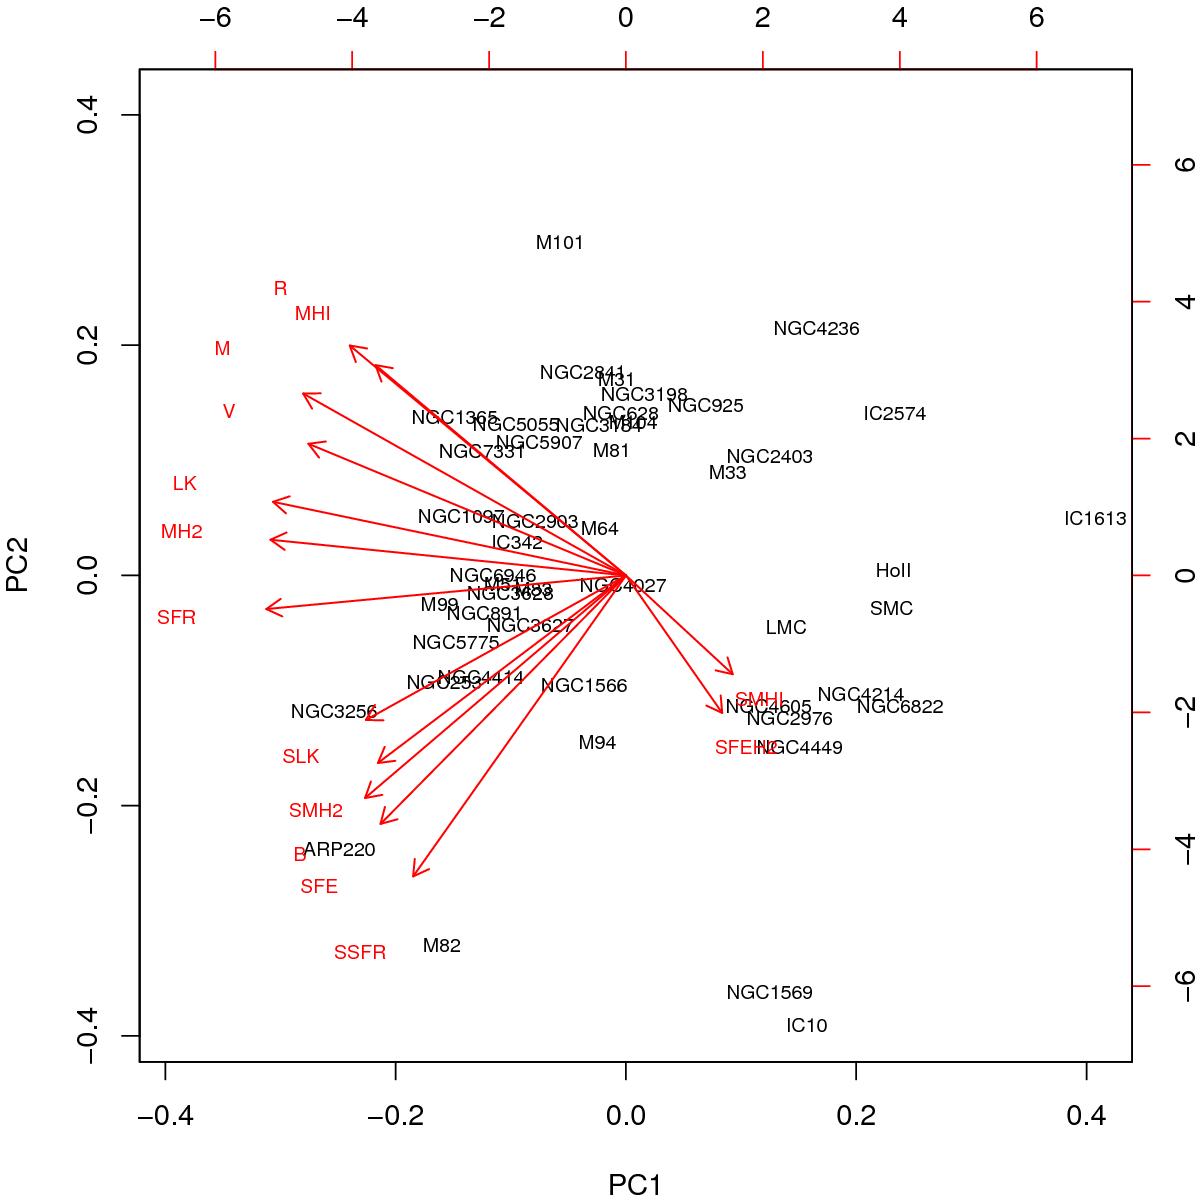
Biplot obtained from PCA of all galaxy parameters, showing the positions of individual galaxies and the directions of the original variables (arrows) as projected into the plane of the first two PCs. The horizontal axis is the most varying direction of the data-set. The positions of galaxies were scaled down by the standard deviation of the corresponding PCs multiplied by the square root of the number of observations (bottom and left-hand axes), while the vectors were scaled up by the same values (top and right-hand axes).
Current usage metrics show cumulative count of Article Views (full-text article views including HTML views, PDF and ePub downloads, according to the available data) and Abstracts Views on Vision4Press platform.
Data correspond to usage on the plateform after 2015. The current usage metrics is available 48-96 hours after online publication and is updated daily on week days.
Initial download of the metrics may take a while.