Fig. 7
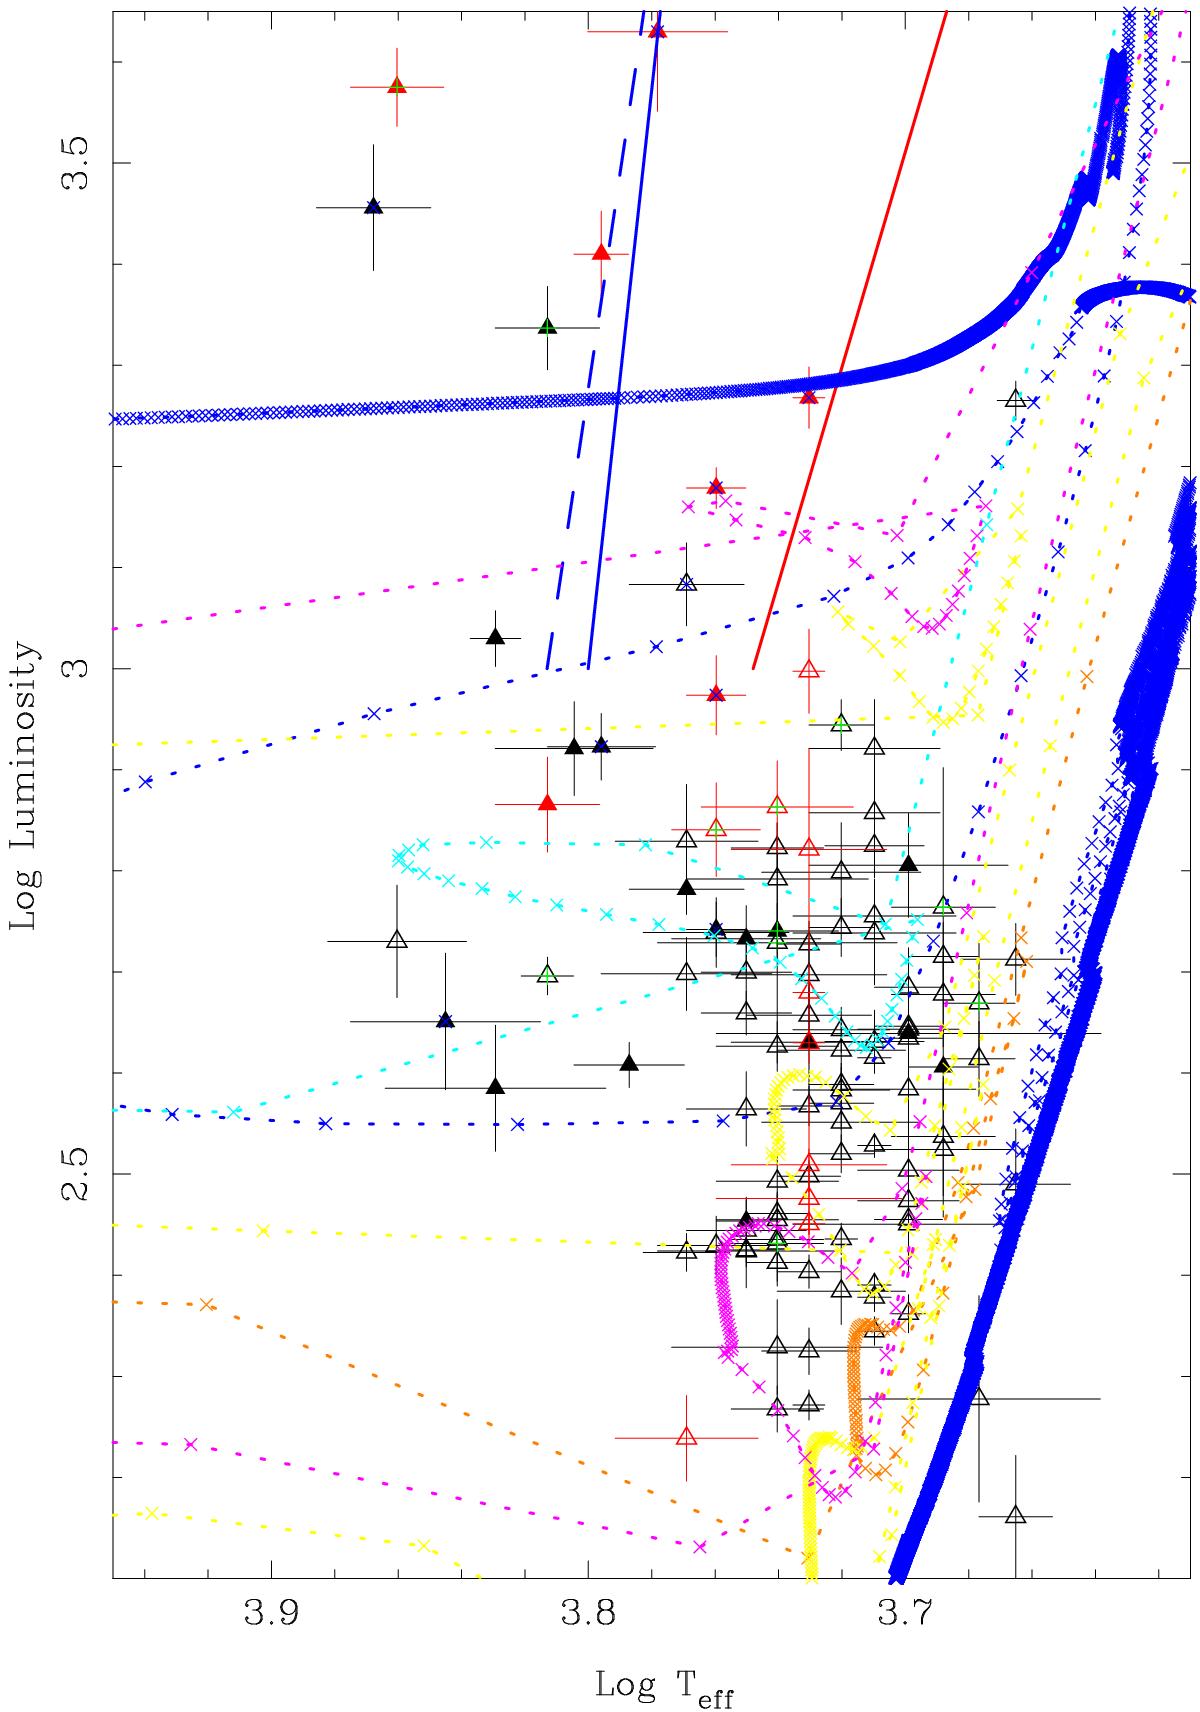
As Fig. 3 but only for the (p)WVir. For reference, the fundamental mode (solid line) and first overtone (dashed line) blue (for Z = 0.004) and red edge (for Z = 0.008) of the IS of classical Cepheids are indicated Bono et al. (2000). Tracks from the BaSTI database (Pietrinferni et al. 2004) are plotted in light blue (Z = 0.001), magnenta (Z = 0.002), yellow (Z = 0.004), and brown (Z = 0.008) for stars with initial masses of 2.5 M⊙ (2 models, bluest extension between log L = 2.2–2.4), 3.0 M⊙ (3 models, bluest extension between log L = 2.35–2.8), and 4.0 M⊙ (2 models, bluest extension between log L = 3.0–3.2). A point is plotted for every 1 Myr of evolution. The dark blue track represents the evolutionary track (Miller Bertolami, priv. comm.) of a star with 0.60 M⊙ at the ZAHB that evolved through the AGB and experiences a TP, which results in the star crossing the IS. The evolution in that region is very fast. Each points represents 10 yr of evolution.
Current usage metrics show cumulative count of Article Views (full-text article views including HTML views, PDF and ePub downloads, according to the available data) and Abstracts Views on Vision4Press platform.
Data correspond to usage on the plateform after 2015. The current usage metrics is available 48-96 hours after online publication and is updated daily on week days.
Initial download of the metrics may take a while.