Fig. 6
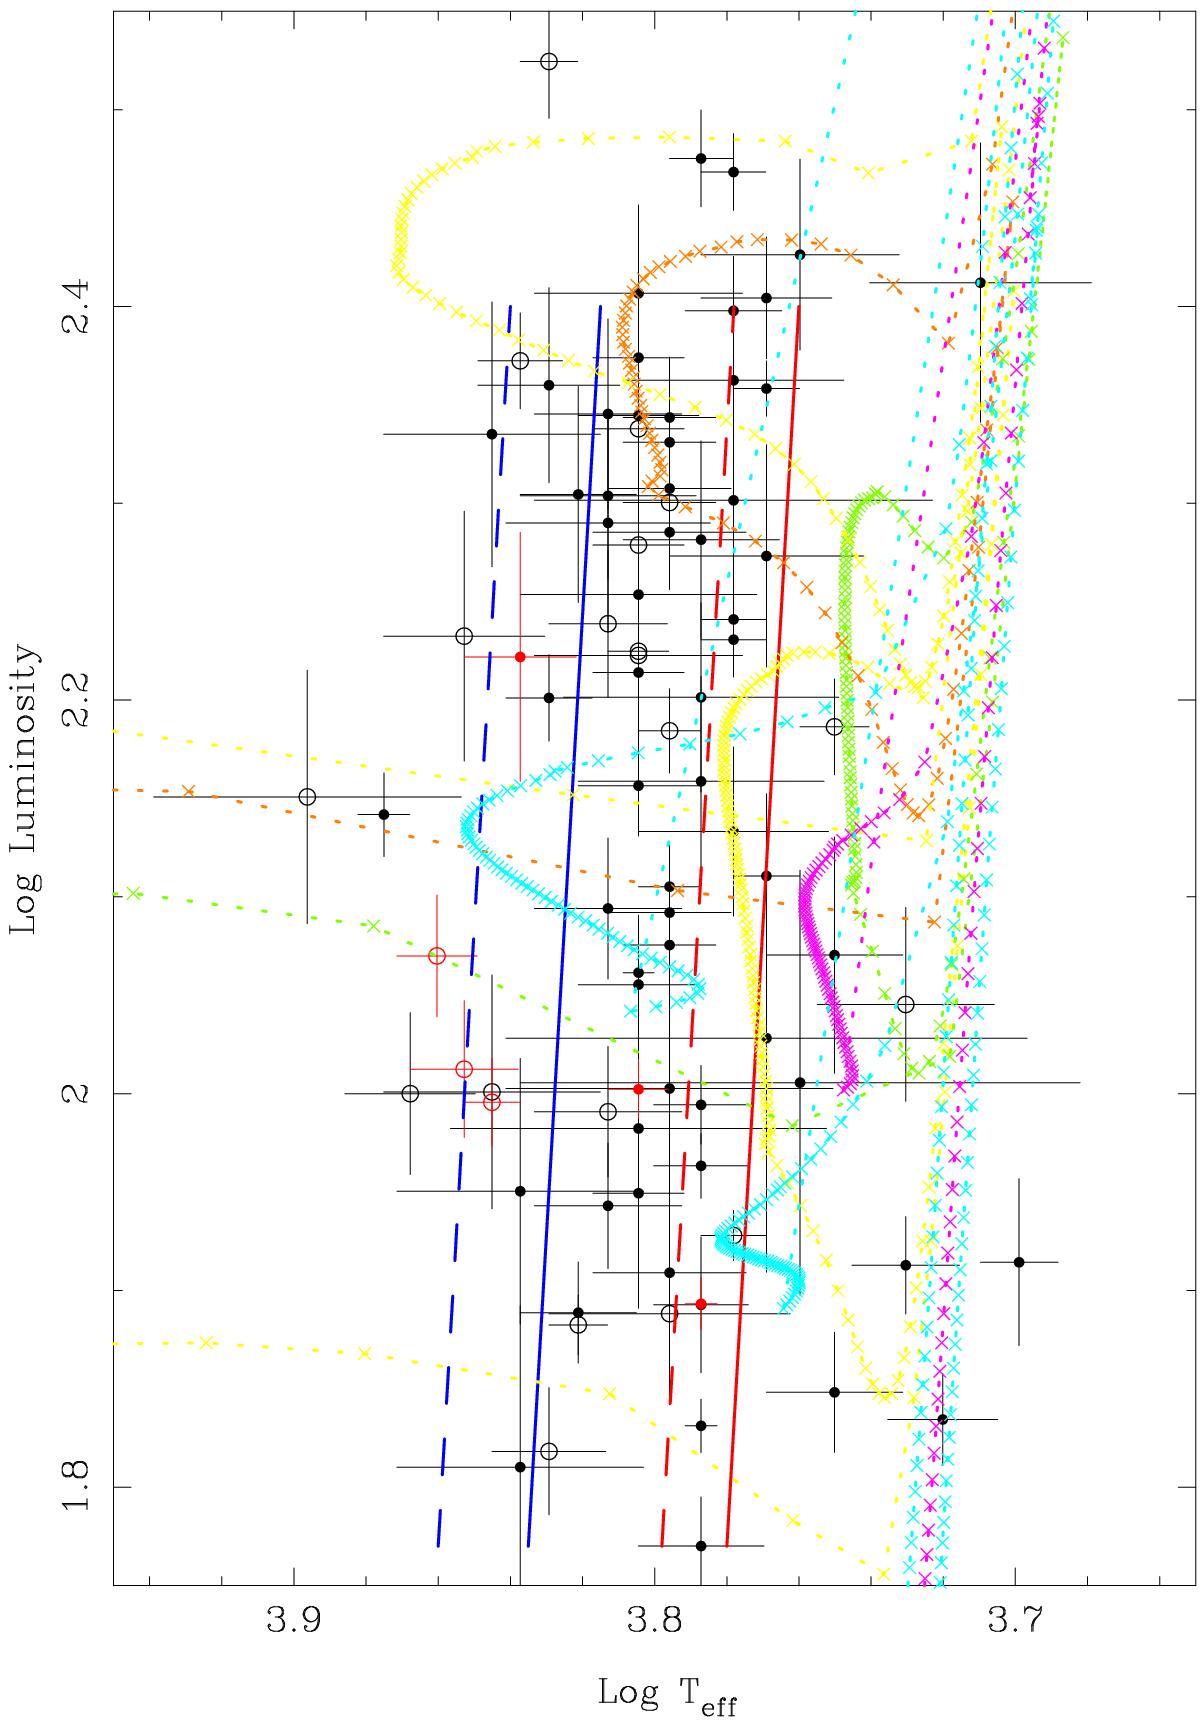
As Fig. 3 but only for the AC objects. The fundamental mode (solid line) and first overtone (dashed line) blue and red edge of the IS of AC are indicated (Fiorentino et al. 2006). Tracks from the BaSTI database (Pietrinferni et al. 2004) are plotted in light blue (Z = 0.0001), magenta (Z = 0.0003), yellow (Z = 0.0006), brown (Z = 0.001), green (Z = 0.002) for stars of 1.1 M⊙ (1 model, bluest extension near log L ~ 1.9), 1.5 M⊙ (2 models, bluest extension near log L ~ 2.1), 1.9 M⊙ (1 model, bluest extension near log L ~ 2.2), and 2.3 M⊙ (3 models, bluest extension between log L = 2.25–2.45). A point is plotted for every 1 Myr of evolution.
Current usage metrics show cumulative count of Article Views (full-text article views including HTML views, PDF and ePub downloads, according to the available data) and Abstracts Views on Vision4Press platform.
Data correspond to usage on the plateform after 2015. The current usage metrics is available 48-96 hours after online publication and is updated daily on week days.
Initial download of the metrics may take a while.