Free Access
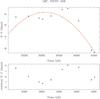
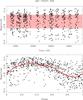
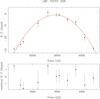
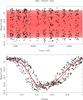
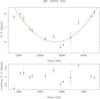
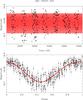
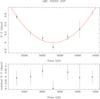
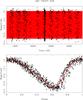
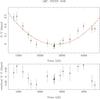
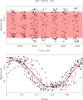
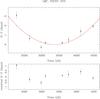
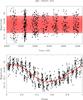
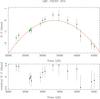
Fig. C.4
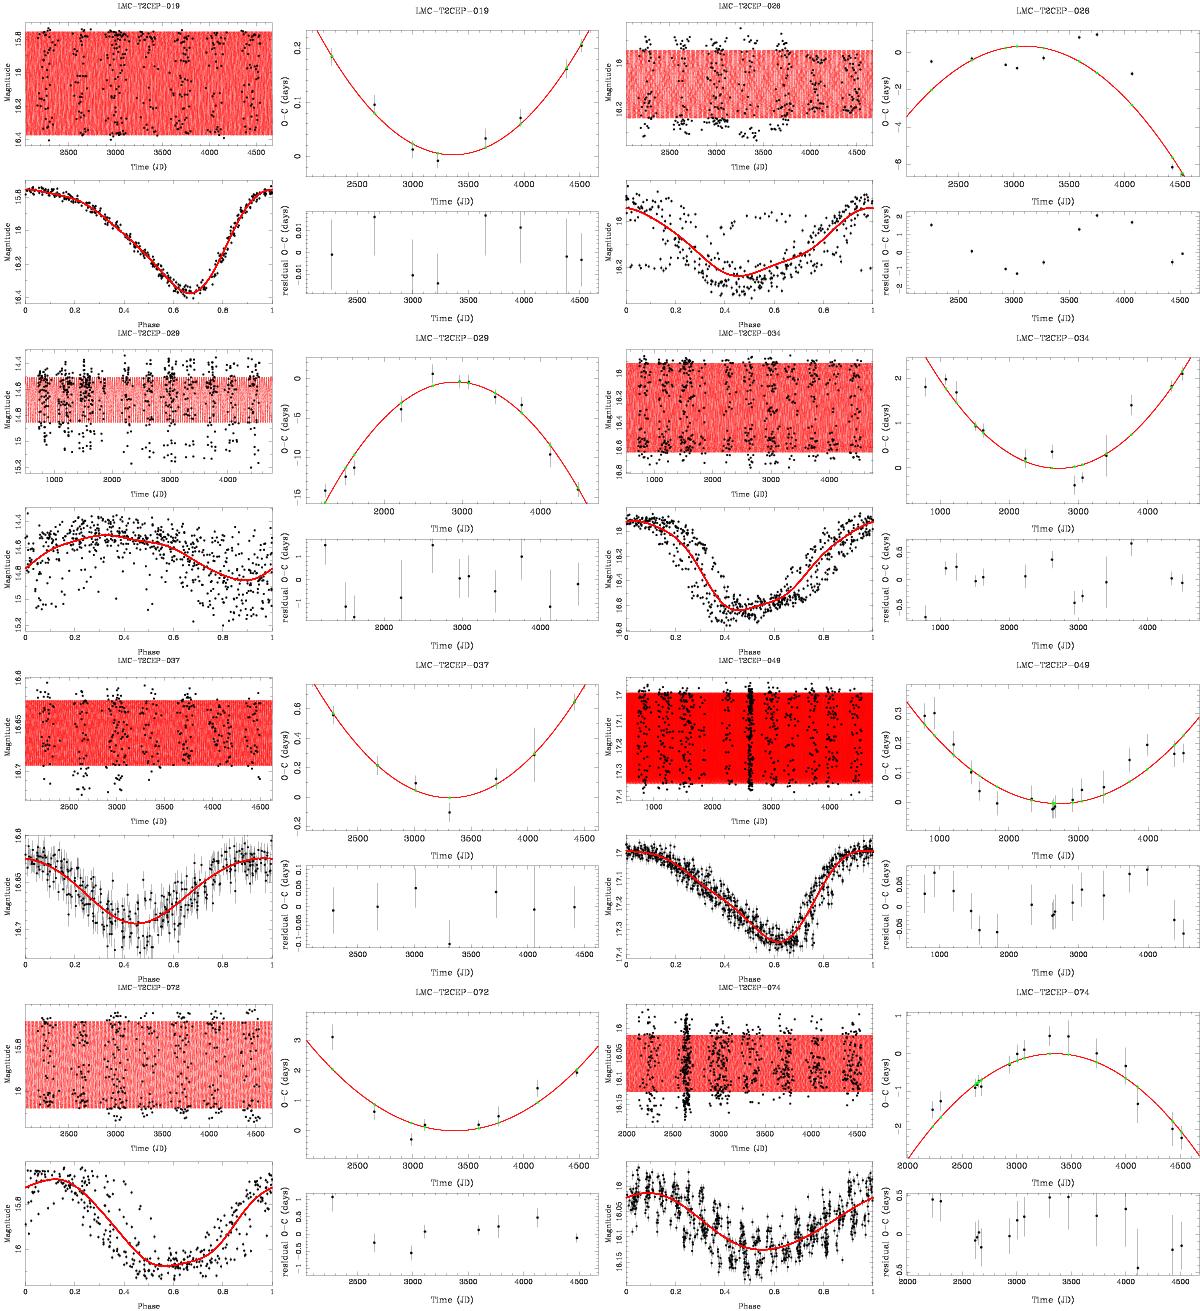
Light curves and O−C diagrams of the stars showing a significant change in period. The left-hand panel shows the time series (top) and phased light curve (bottom). The right-hand panel shows the O−C diagram (top) and the model and the residuals after subtracting the model (bottom).
This figure is made of several images, please see below:
Current usage metrics show cumulative count of Article Views (full-text article views including HTML views, PDF and ePub downloads, according to the available data) and Abstracts Views on Vision4Press platform.
Data correspond to usage on the plateform after 2015. The current usage metrics is available 48-96 hours after online publication and is updated daily on week days.
Initial download of the metrics may take a while.