Fig. 5
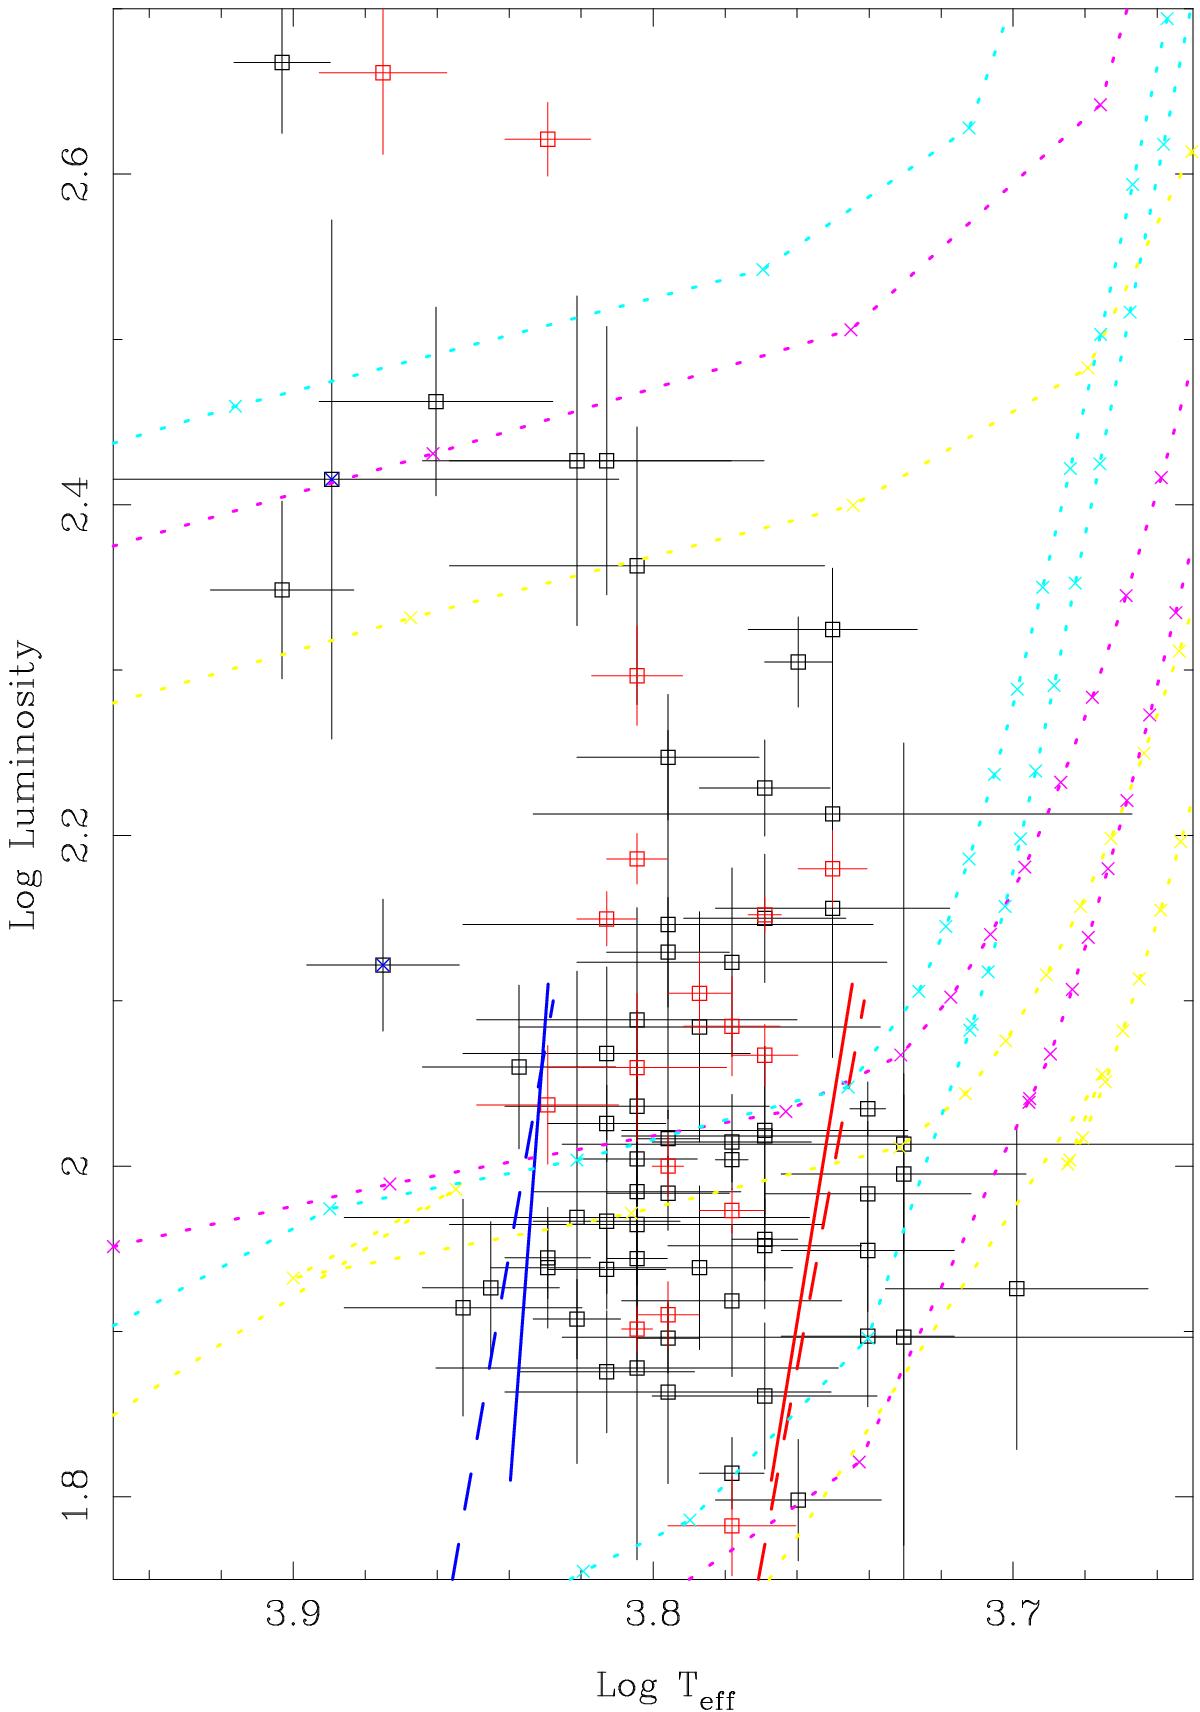
As Fig. 3 but only for the BLH objects. The blue and red edge of the fundamental mode IS of BLH (between log L ~ 1.81–2.1, for a mass of 0.65 M⊙) are indicated by the solid line (Di Criscienzo et al. 2007). The dashed lines indicate the location of the first overtone blue edge and fundamental mode red edge of RR Lyrae (see text). PARSEC horizontal branch models (Bressan et al. 2012) are plotted in light blue (Z = 0.001), magenta (Z = 0.004), and yellow (Z = 0.008) for, respectively, 0.515, 0.56, 0.62 M⊙ (decreasing in luminosity), 0.505, 0.53, 0.57 M⊙, and 0.50, 0.52, 0.57 M⊙ (see text). A point is plotted for every 1 Myr of evolution.
Current usage metrics show cumulative count of Article Views (full-text article views including HTML views, PDF and ePub downloads, according to the available data) and Abstracts Views on Vision4Press platform.
Data correspond to usage on the plateform after 2015. The current usage metrics is available 48-96 hours after online publication and is updated daily on week days.
Initial download of the metrics may take a while.