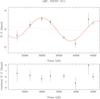
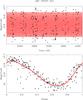
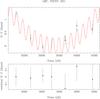
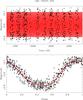
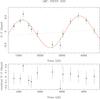
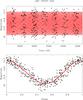
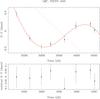
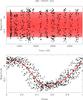
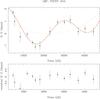
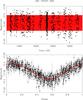
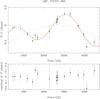
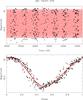
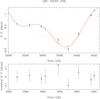
Fig. C.3
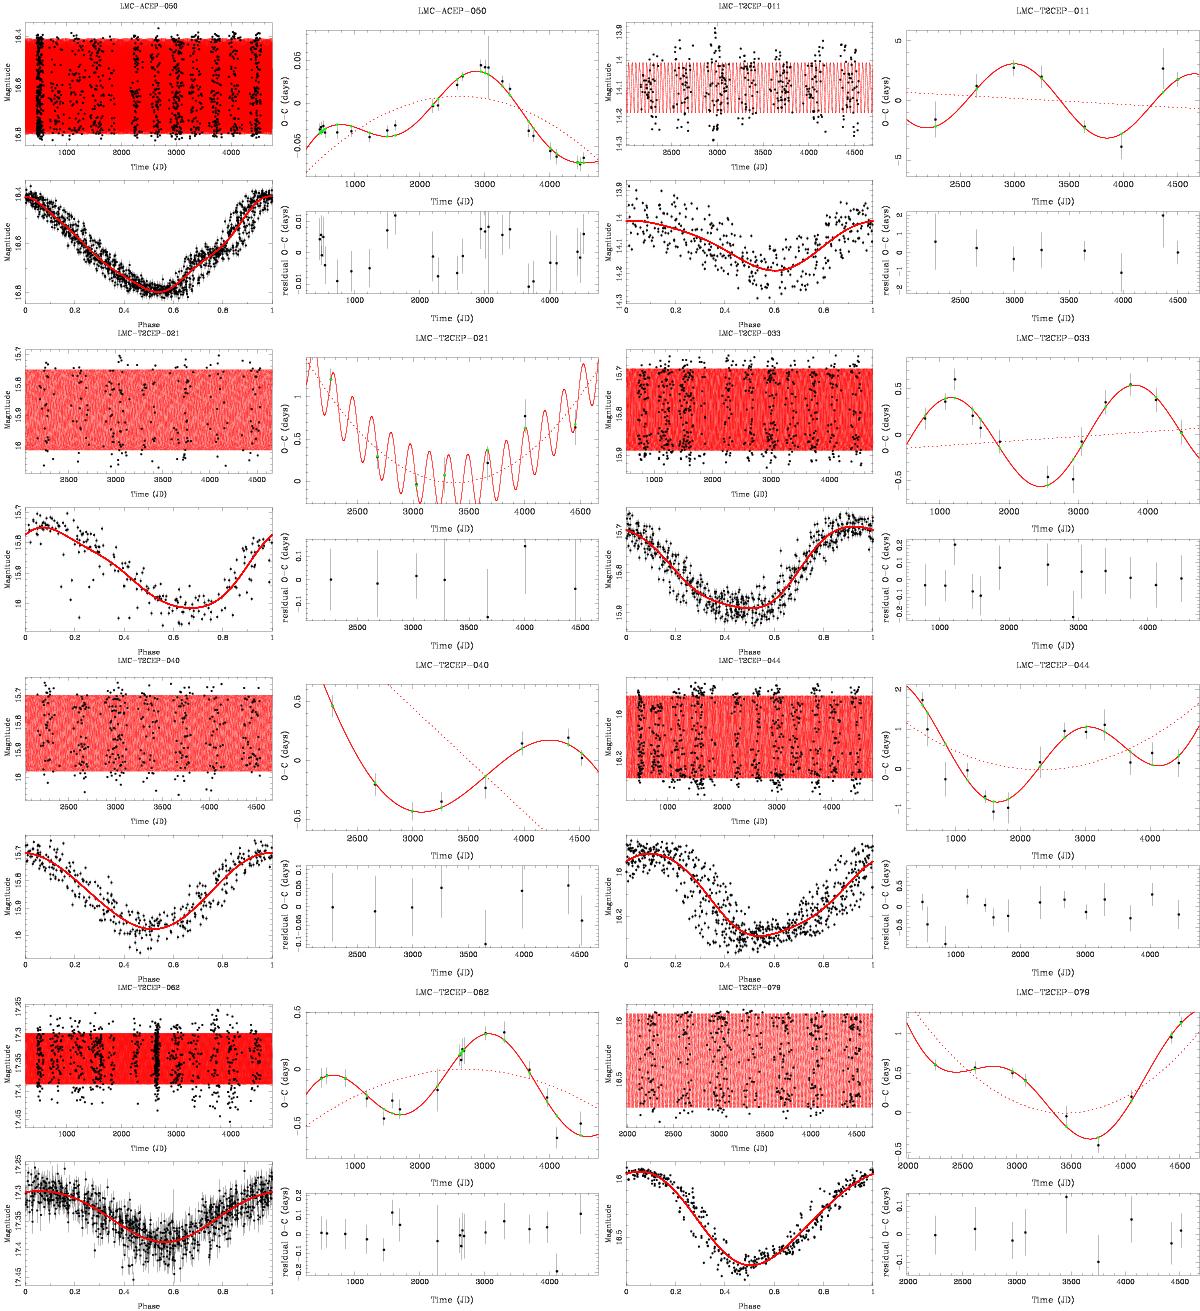
Light curves and O−C diagrams of candidate binary stars based on the LITE. The left-hand panel shows the time series (top) and phased light curve (bottom). The right-hand panel shows the O−C diagram (top) and the residual after subtracting the model (bottom). The full model is represented by the full line. The contribution due to a changing period is indicated by the dotted line.
Current usage metrics show cumulative count of Article Views (full-text article views including HTML views, PDF and ePub downloads, according to the available data) and Abstracts Views on Vision4Press platform.
Data correspond to usage on the plateform after 2015. The current usage metrics is available 48-96 hours after online publication and is updated daily on week days.
Initial download of the metrics may take a while.