Fig. 4
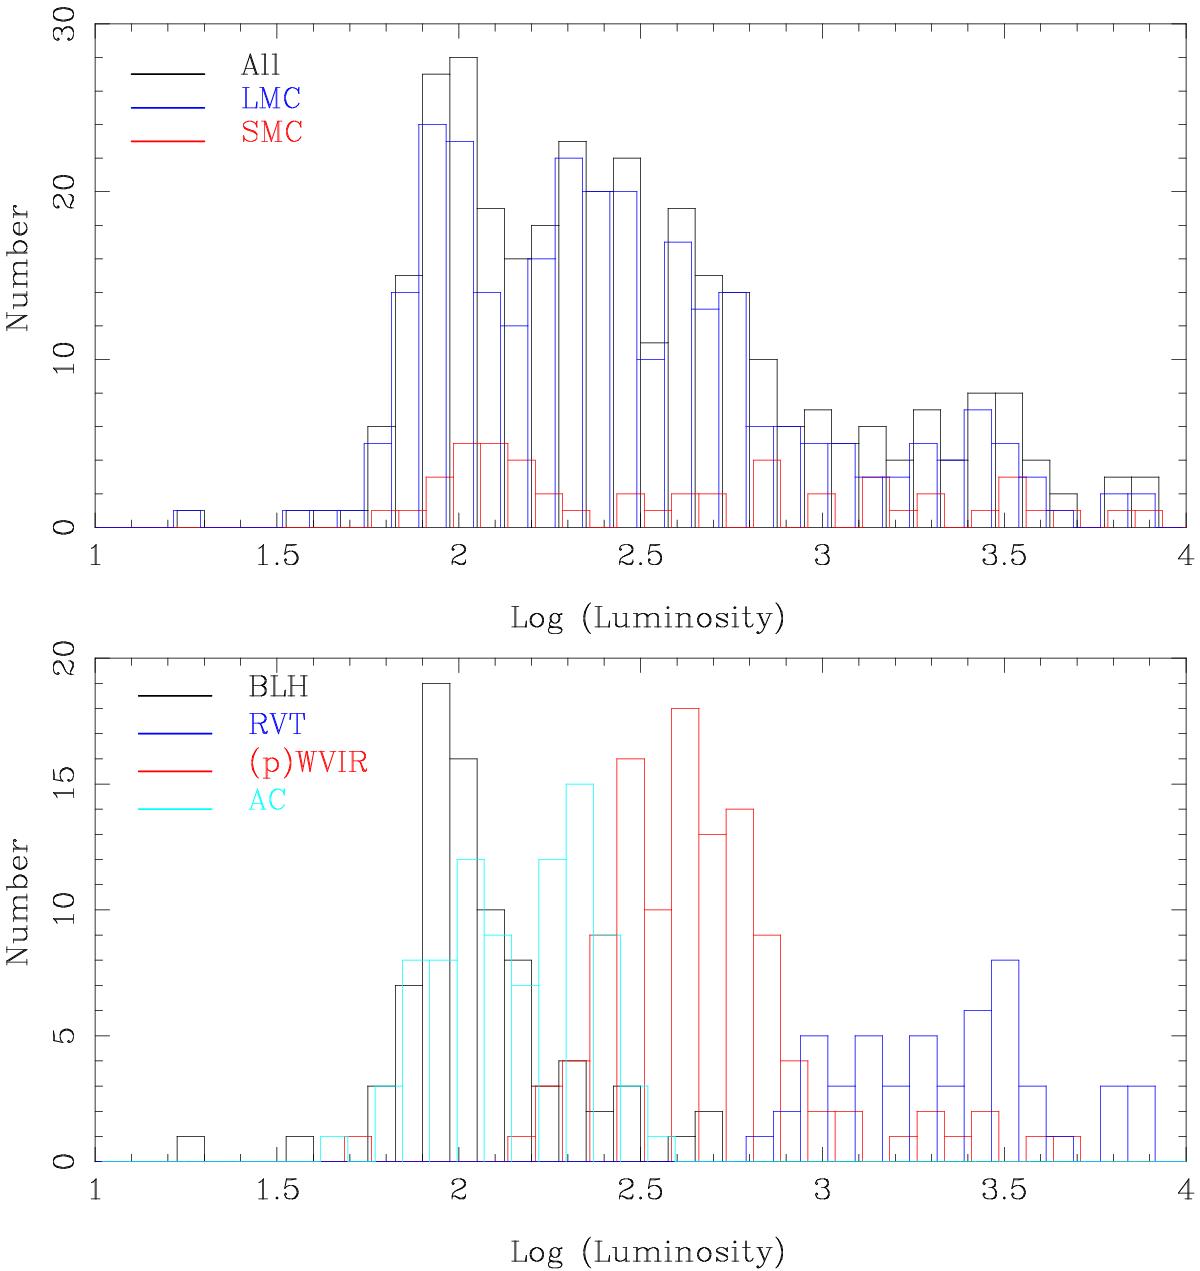
Histogram of the distribution over luminosity. In the top panel the black, red, and blue histograms represent all the SMC, and LMC objects, respectively. The latter two are slightly offset by ±0.01 in log L for clarity. The bottom panel shows the distributions for SMC and LMC objects according to type: BLH (black), ACs (light blue), (p)WVir (red), and RVT (dark blue). The histograms are offset by ±0.01 in log L for clarity.
Current usage metrics show cumulative count of Article Views (full-text article views including HTML views, PDF and ePub downloads, according to the available data) and Abstracts Views on Vision4Press platform.
Data correspond to usage on the plateform after 2015. The current usage metrics is available 48-96 hours after online publication and is updated daily on week days.
Initial download of the metrics may take a while.