Fig. 3
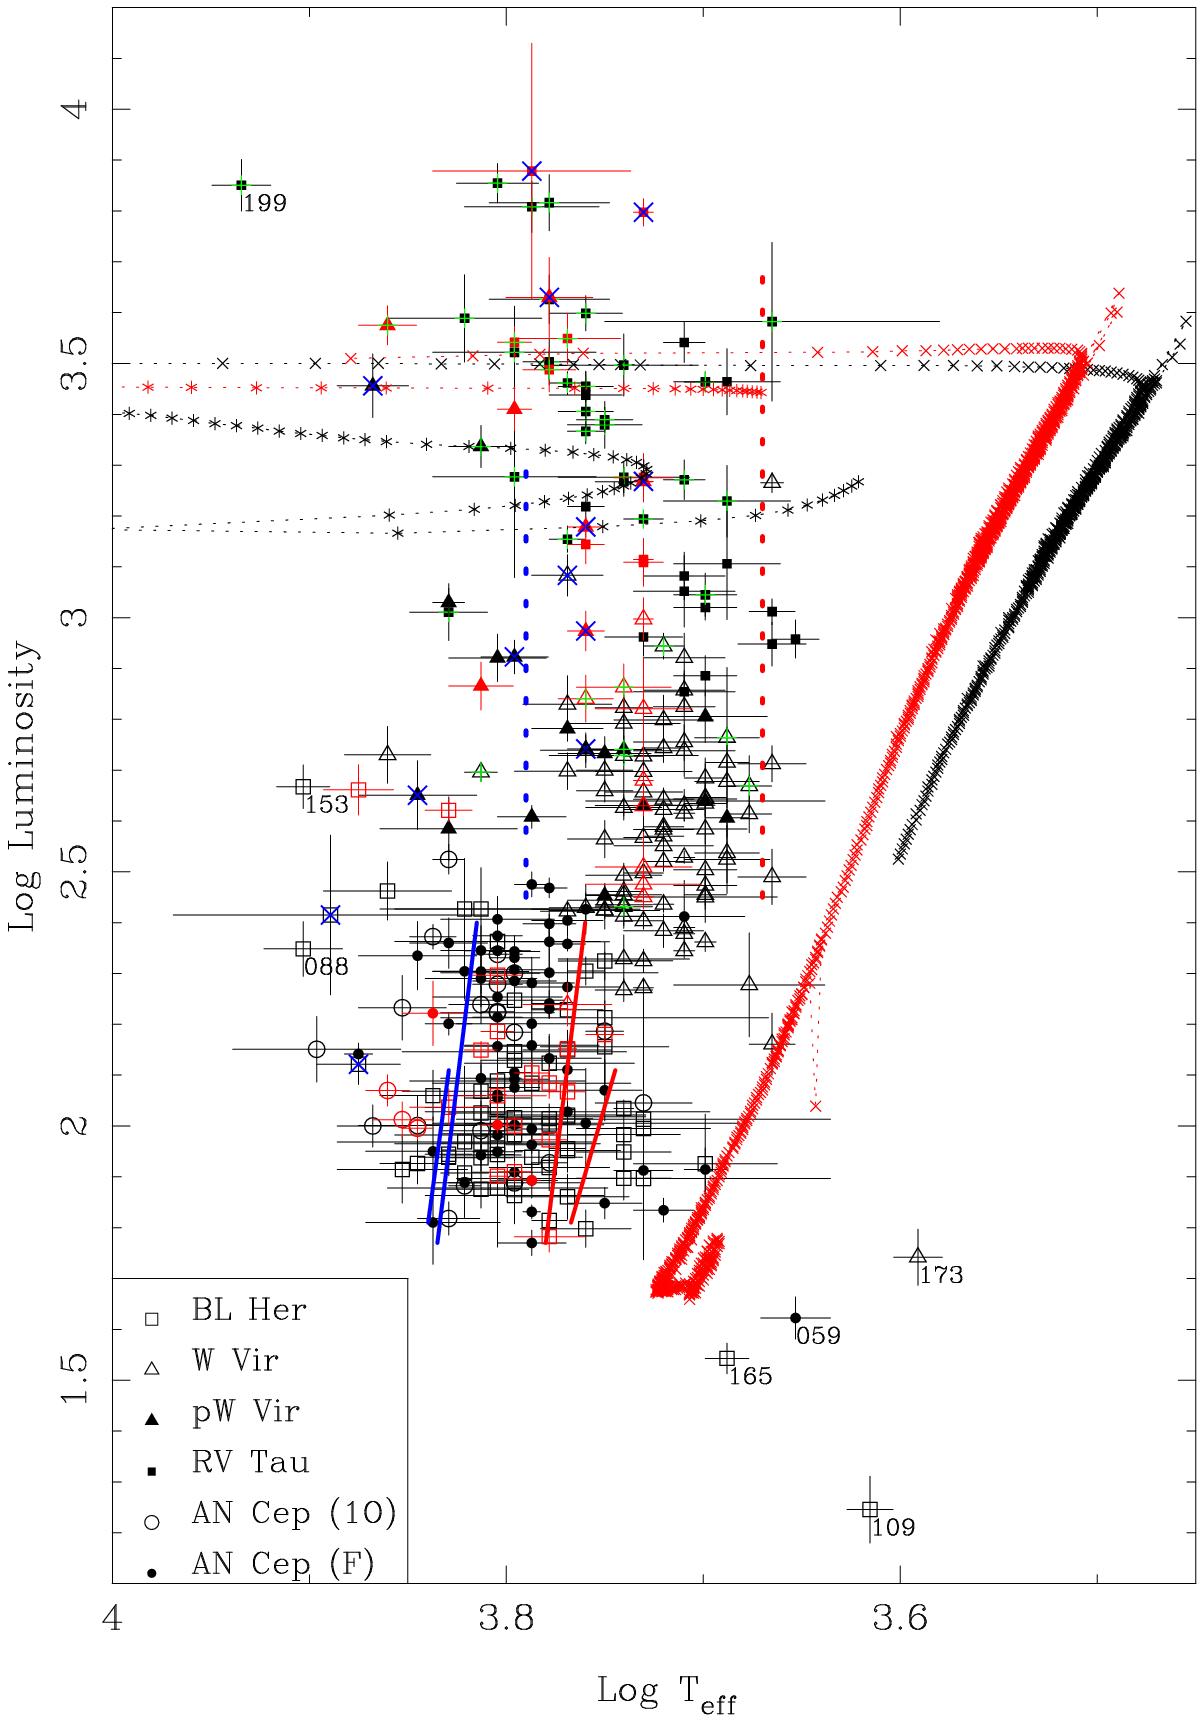
Physical Hertzsprung-Russell diagram. Stars in the SMC are plotted in red. Stars with an IR excess are indicated by a green plus sign. Stars that show eclipsing or ellipsoidal variations according to OGLE are indicated by a blue cross. The tracks plotted with × are the lowest initial mass tracks of Vassiliadis & Wood (1993) for the LMC (0.945 M⊙), and SMC (0.89 M⊙, in red). The final masses are 0.555 and 0.558 M⊙, respectively. The tracks plotted with a ∗ are the lowest initial mass tracks of Miller Bertolami (2016) for a metallicity of Z = 0.01 (1.0 M⊙, current mass 0.534 M⊙), and Z = 0.001 (0.9 M⊙, current mass 0.536 M⊙, in red). In both tracks every tick marked represents 500 yr of evolution. The blue and red edge of the fundamental mode IS of BLH (between log L ~ 1.81–2.1, for a mass of 0.65 M⊙) and FU ACs (between log L ~ 1.77–2.4) are indicated by the solid line (see text). The vertical dotted lines indicate the location of most of the variables at higher luminosity (see text). Some stars are labelled by their identifier.
Current usage metrics show cumulative count of Article Views (full-text article views including HTML views, PDF and ePub downloads, according to the available data) and Abstracts Views on Vision4Press platform.
Data correspond to usage on the plateform after 2015. The current usage metrics is available 48-96 hours after online publication and is updated daily on week days.
Initial download of the metrics may take a while.