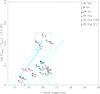
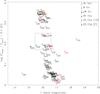
Fig. 10
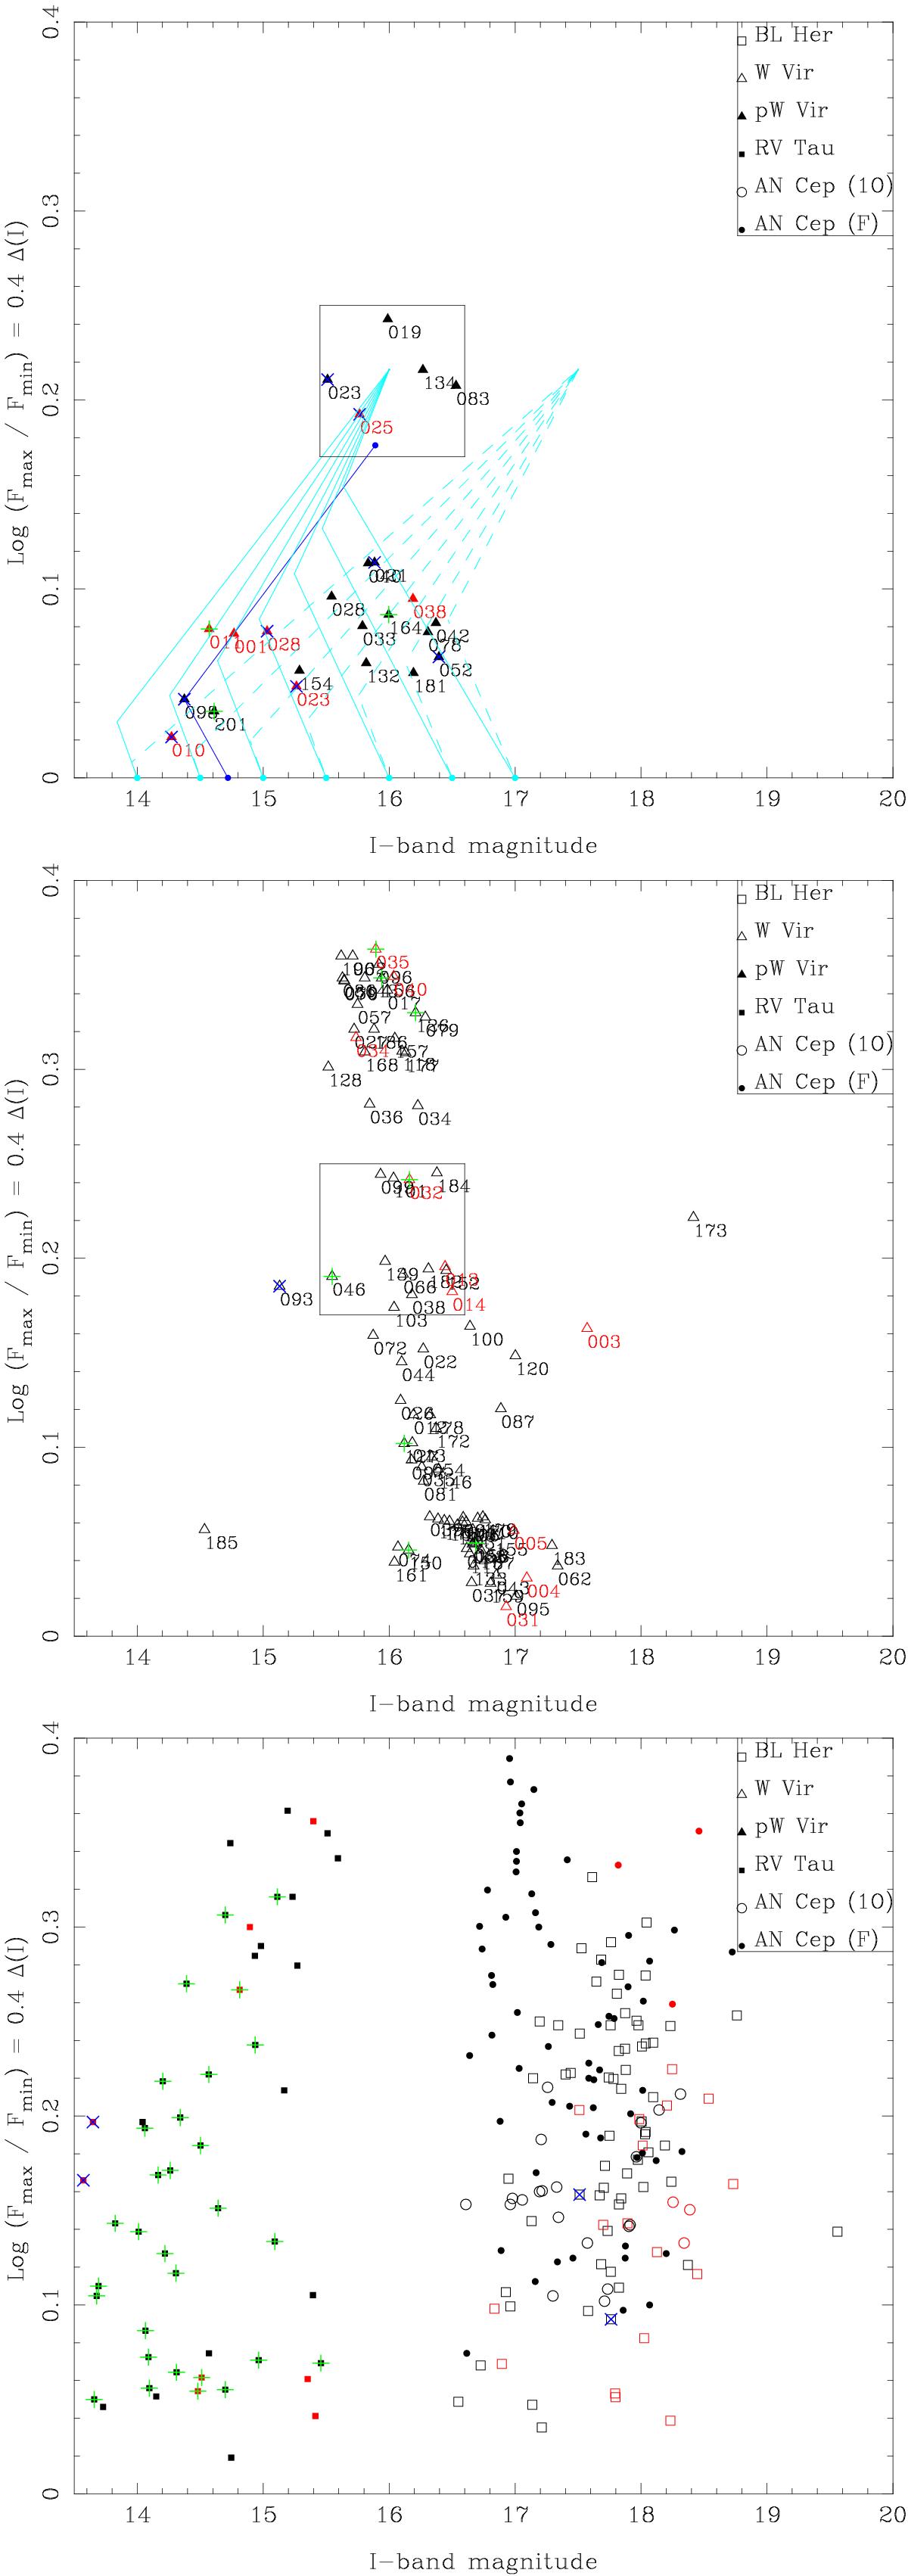
Logarithm of the ratio between the flux at maximum and minimum light, i.e. 0.4 × the peak-to-peak amplitude, vs. mean I-band magnitudes for the pWVir (top), WVir (middle), and all other (bottom) objects. Stars with an IR excess are indicated by a green plus sign. Stars that show eclipsing or ellipsoidal variations according to OGLE are indicated by a blue cross. For the pWVir object -098 (MACHO 6.6454.5), a known eclipsing system, the location of the two components is also indicated by dark blue lines. The light blue lines indicate the location of two hypothetical binary systems, consisting of a pulsating component with a fixed amplitude and an increasingly fainter non-pulsating component. The pWVir stars that appear like normal WVir are enclosed by a box that is repeated in the middle panel.
Current usage metrics show cumulative count of Article Views (full-text article views including HTML views, PDF and ePub downloads, according to the available data) and Abstracts Views on Vision4Press platform.
Data correspond to usage on the plateform after 2015. The current usage metrics is available 48-96 hours after online publication and is updated daily on week days.
Initial download of the metrics may take a while.