Free Access
Fig. 9
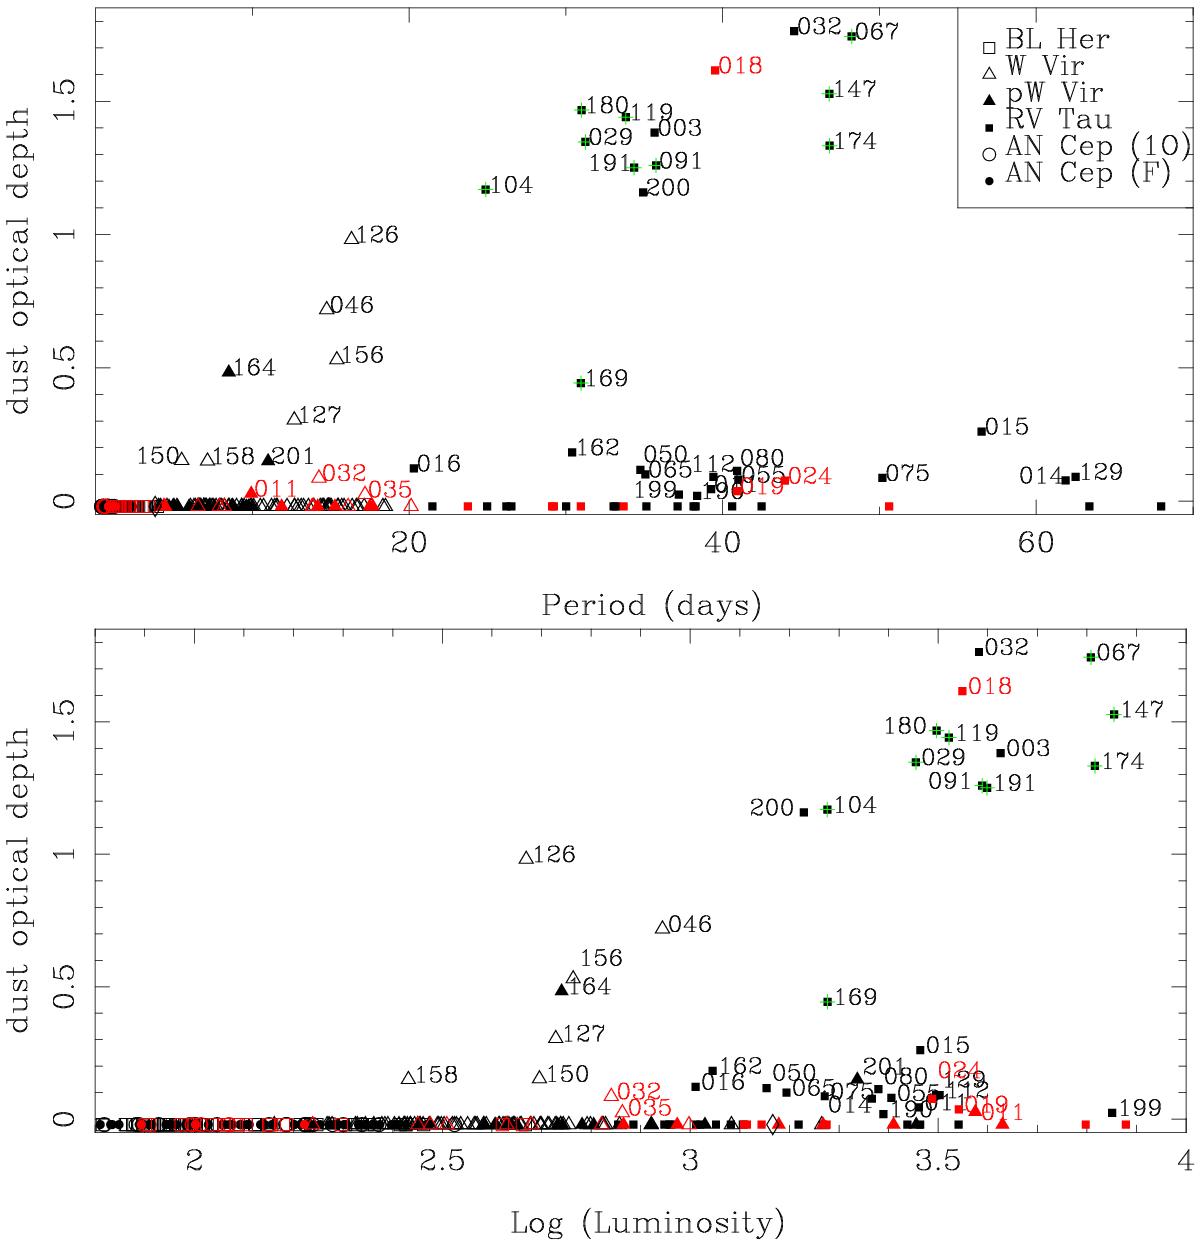
Dependence of the derived dust optical depth on pulsation period and log L. Stars in the SMC are plotted in red. Stars with an IRS spectrum are indicated by a green plus sign. Stars with a detectable IR excess are labelled by their identifier.
This figure is made of several images, please see below:
Current usage metrics show cumulative count of Article Views (full-text article views including HTML views, PDF and ePub downloads, according to the available data) and Abstracts Views on Vision4Press platform.
Data correspond to usage on the plateform after 2015. The current usage metrics is available 48-96 hours after online publication and is updated daily on week days.
Initial download of the metrics may take a while.