Fig. 1
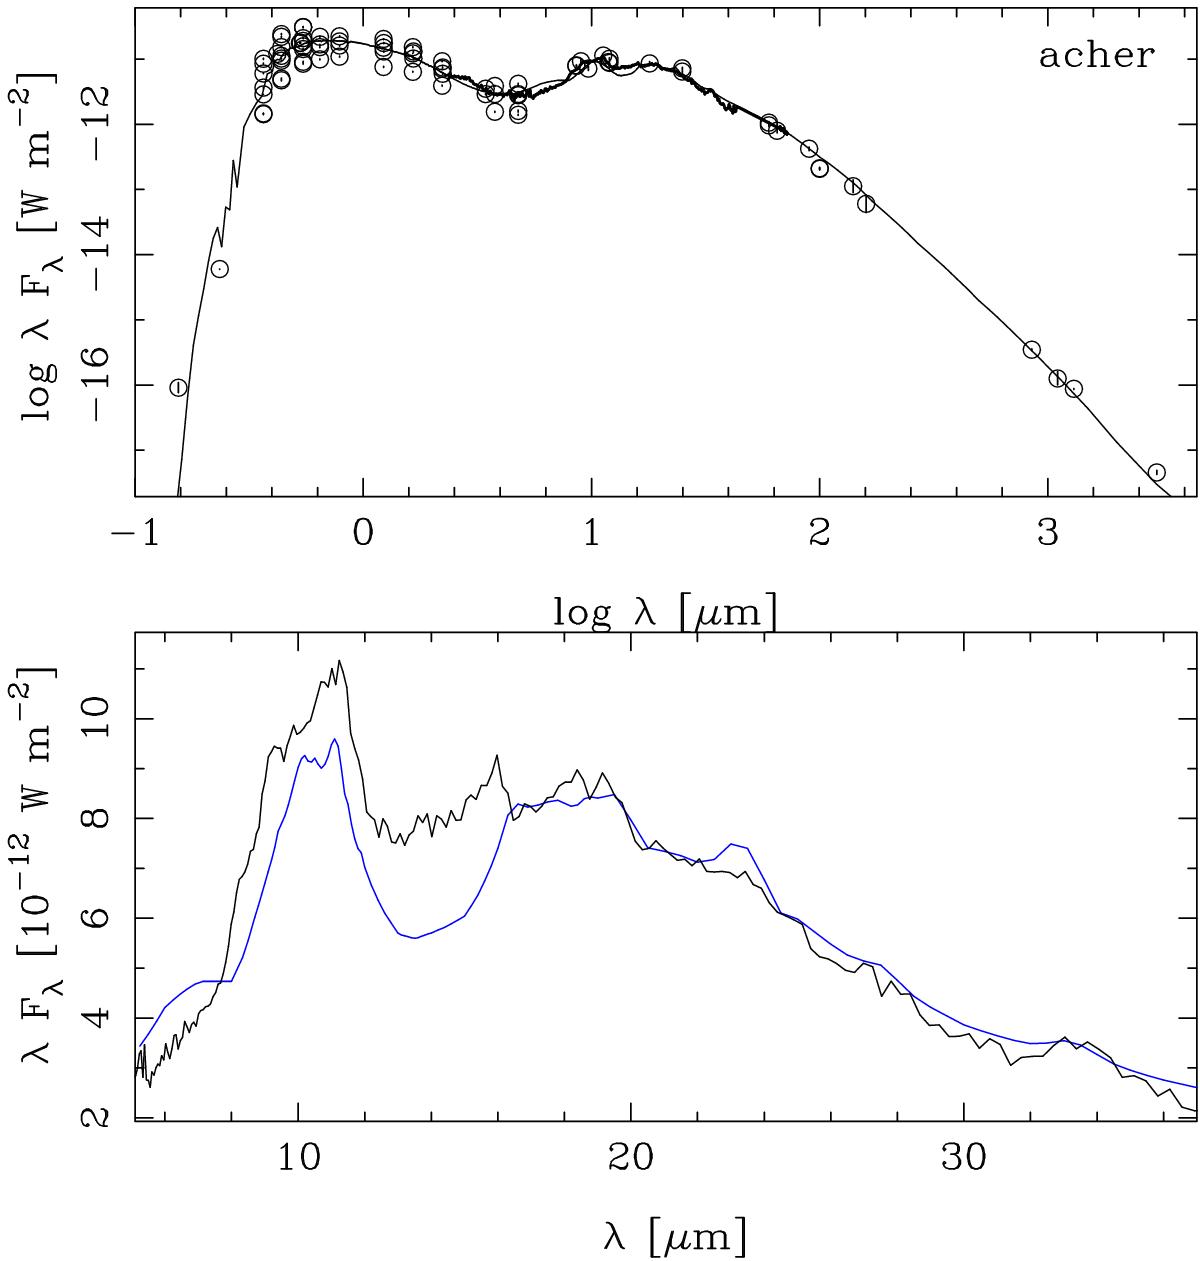
Fit to the SED and ISO SWS spectrum (Sloan et al. 2003) of AC Her, with a two-component wind, illustrating the dust mix that has been used in fitting the stars, which show a clear MIR excess. In the bottom panel the model is scaled to the observed flux in the 20.5–22.5 μm region to facilitate the comparison of the dust features.
Current usage metrics show cumulative count of Article Views (full-text article views including HTML views, PDF and ePub downloads, according to the available data) and Abstracts Views on Vision4Press platform.
Data correspond to usage on the plateform after 2015. The current usage metrics is available 48-96 hours after online publication and is updated daily on week days.
Initial download of the metrics may take a while.