Fig. 3
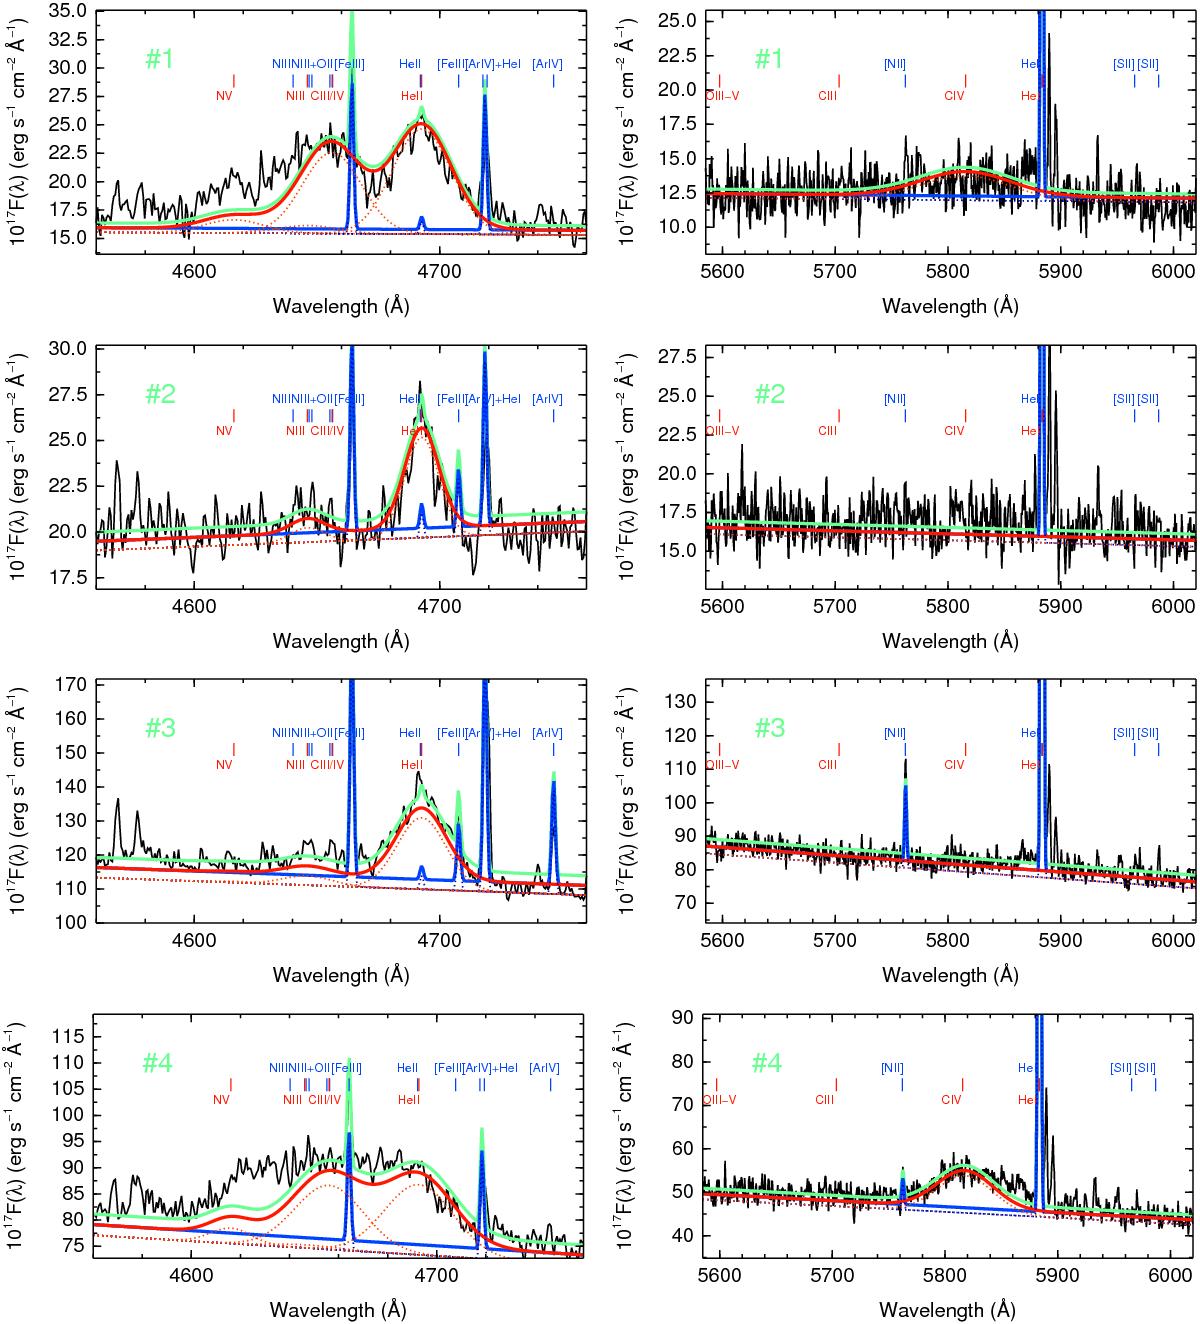
Spectra in selected apertures presenting Wolf-Rayet features. The total modelled spectrum is shown in green whilst the fluxes corresponding to the W-R stellar features and nebular lines are shown in red and blue continuous lines, respectively, with a small offset. Additionally, individual fits for each feature are shown as dotted lines. The positions of the nebular emission lines are indicated with blue ticks and labels, whilst those corresponding to Wolf-Rayet features appear in red. Apertures were numbered according to decreasing right ascension and increasing declination. Their locations and sizes are shown in Fig. 2.
Current usage metrics show cumulative count of Article Views (full-text article views including HTML views, PDF and ePub downloads, according to the available data) and Abstracts Views on Vision4Press platform.
Data correspond to usage on the plateform after 2015. The current usage metrics is available 48-96 hours after online publication and is updated daily on week days.
Initial download of the metrics may take a while.