Fig. 6
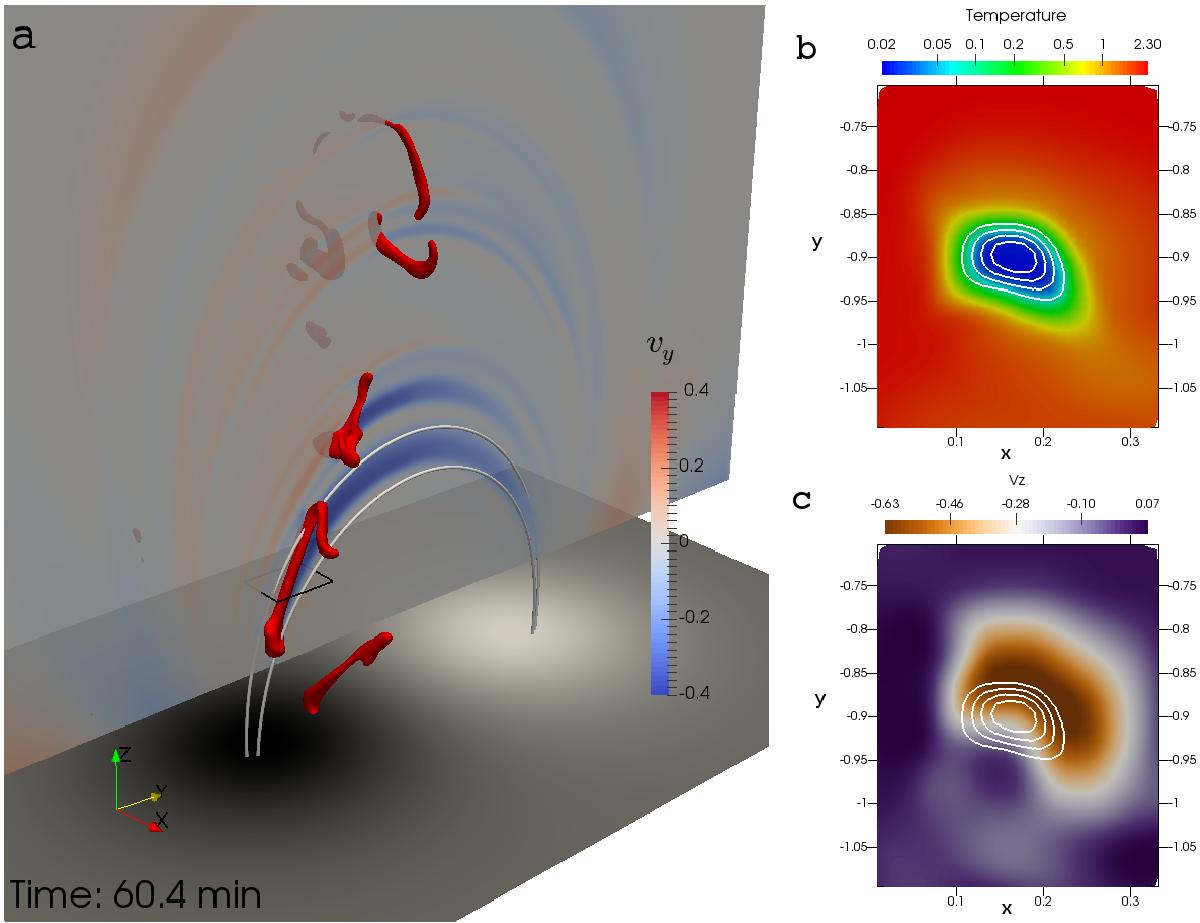
Case study of a stretched coronal rain blob at 60.4 min; a) shows a 3D view of blobs in red isosurface of density, two magnetic field lines going through the head and tail of a blob, a vertical plane cutting through the blobs with translucent color indicating vy; b) shows the horizontal slice through the blob bounded by the black frame in a) colored by temperature with number density contours in values of 7, 11, 15, 19, 23 n0; and c) shows the slice colored by vz with the same density contours as b).
Current usage metrics show cumulative count of Article Views (full-text article views including HTML views, PDF and ePub downloads, according to the available data) and Abstracts Views on Vision4Press platform.
Data correspond to usage on the plateform after 2015. The current usage metrics is available 48-96 hours after online publication and is updated daily on week days.
Initial download of the metrics may take a while.