Fig. 4
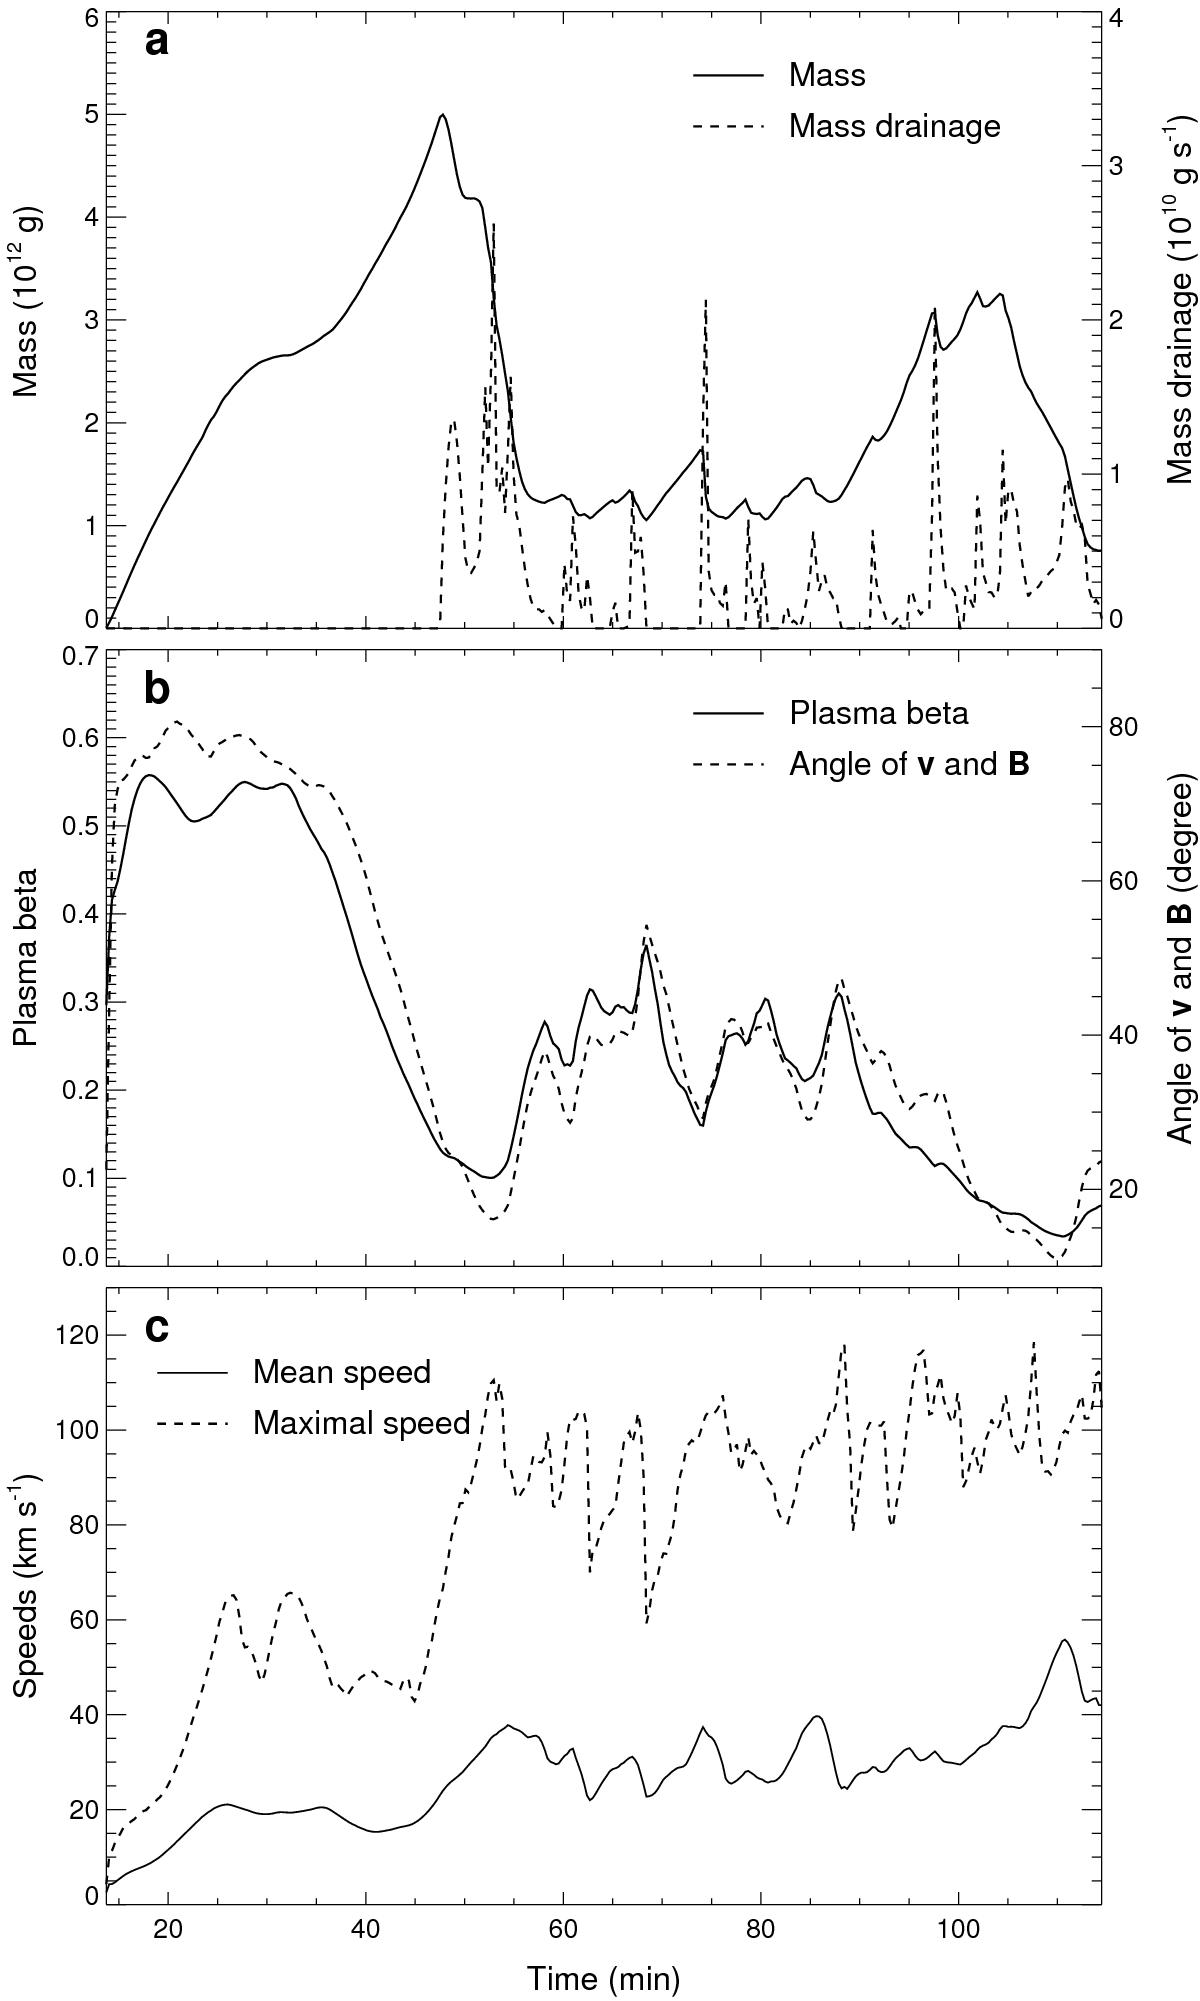
Time evolution of coronal rain plasma properties shown as time curves of a) total coronal rain mass (solid line) and mass drainage rate (dashed line); b) mean plasma β (solid line) and the angle between local velocity and magnetic field vector (dashed line); and c) instantaneous mean speed (solid line) and maximal speed (dashed line) of coronal rain blobs.
Current usage metrics show cumulative count of Article Views (full-text article views including HTML views, PDF and ePub downloads, according to the available data) and Abstracts Views on Vision4Press platform.
Data correspond to usage on the plateform after 2015. The current usage metrics is available 48-96 hours after online publication and is updated daily on week days.
Initial download of the metrics may take a while.