Fig. 2
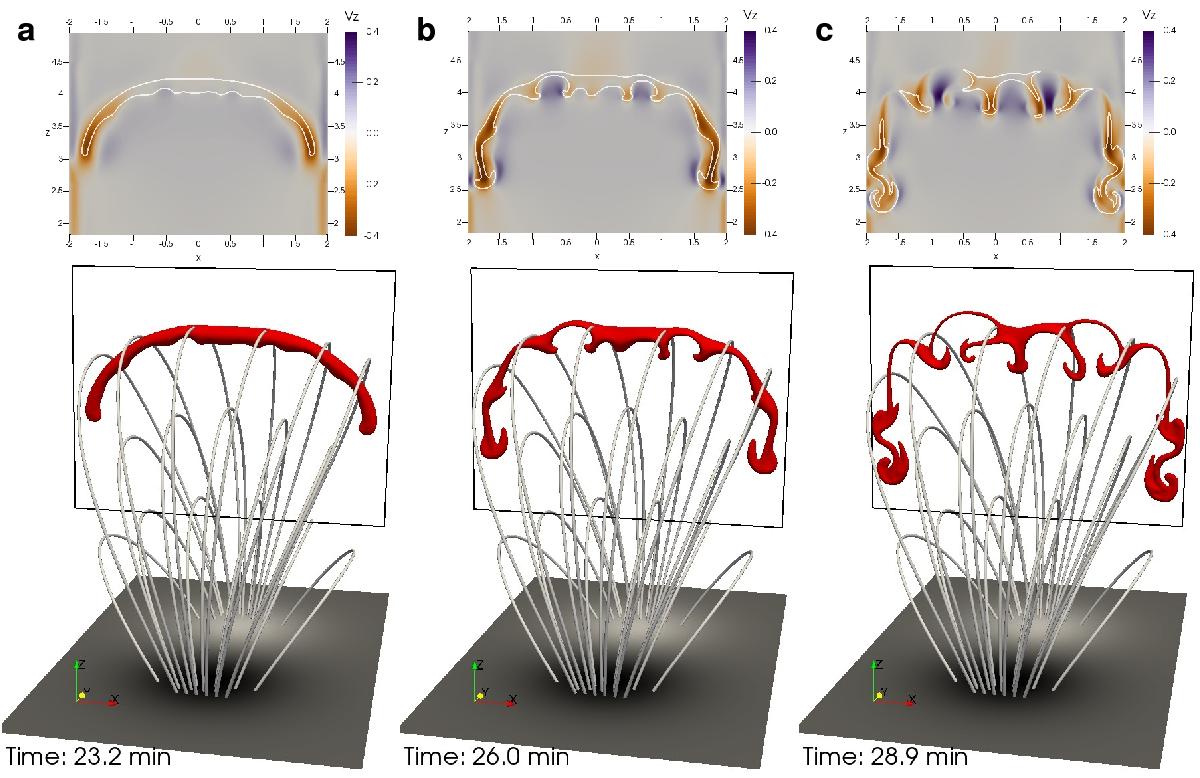
Time series of snapshots (a) at 23.2 min, b) at 26.0 min, c) at 28.9 min) presenting the fragmentation of the large condensation due to RTI. In the top row, vertical slices (x-z planes), depicted by the black frames in the lower 3D views, are colored by the vertical component of velocity with white density contours at number density of 7 × 1010 cm-3.
Current usage metrics show cumulative count of Article Views (full-text article views including HTML views, PDF and ePub downloads, according to the available data) and Abstracts Views on Vision4Press platform.
Data correspond to usage on the plateform after 2015. The current usage metrics is available 48-96 hours after online publication and is updated daily on week days.
Initial download of the metrics may take a while.