Fig. 1
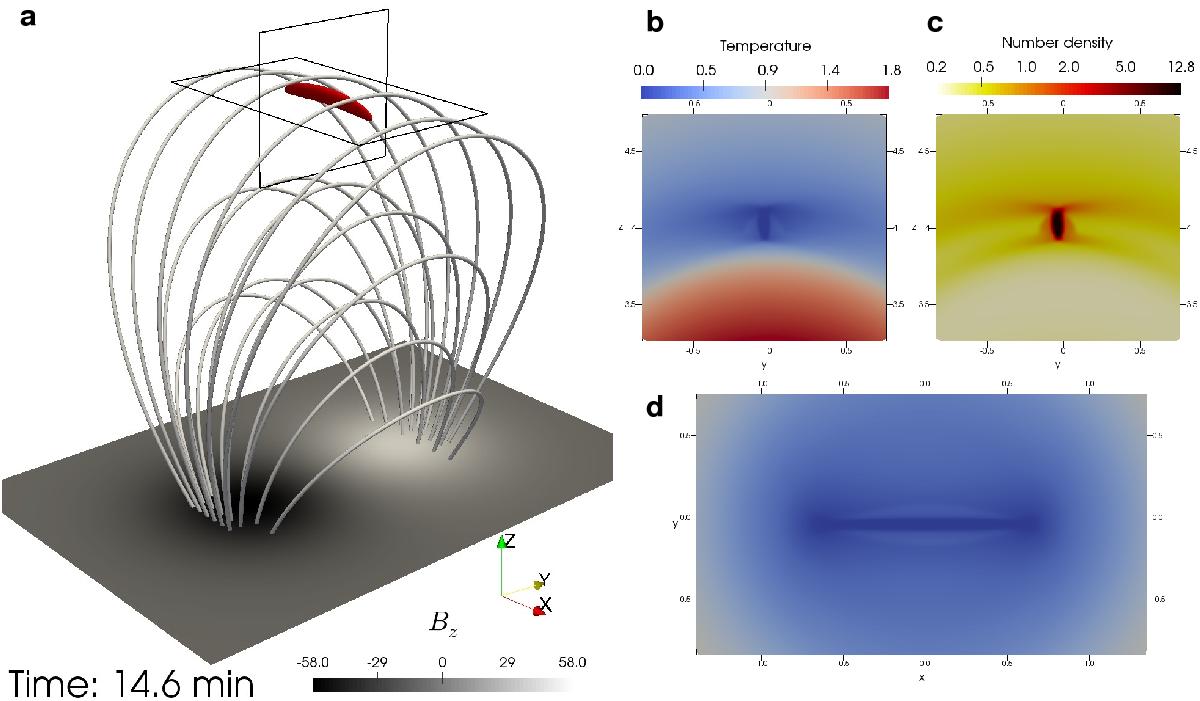
a) A 3D view of the first condensed blob at 14.6 min shown by a red density isosurface at 7 × 109 cm-3 showing the condensed blob, magnetic field lines showing bipolar coronal loops, and bottom plane colored by vertical magnetic field. The field lines are integrated from fixed points at the bottom plane; a vertical slice in the y-z plane (x = 0, bounded by the vertical black frame in a)) through the condensation showing number density in panel b) and temperature in panel c); d) a horizontal slice in the x-y plane (z = 40 Mm, bounded by the horizontal black frame in a)) showing temperature structures with the same color-scale as in panel b) (numbers are dimensionless with according units of time t0, magnetic field B0, temperature T0, and number density n0). We note that all red isosurfaces and bottom magnetograms in the following figures have the same values as defined here.
Current usage metrics show cumulative count of Article Views (full-text article views including HTML views, PDF and ePub downloads, according to the available data) and Abstracts Views on Vision4Press platform.
Data correspond to usage on the plateform after 2015. The current usage metrics is available 48-96 hours after online publication and is updated daily on week days.
Initial download of the metrics may take a while.