Free Access
Fig. 8
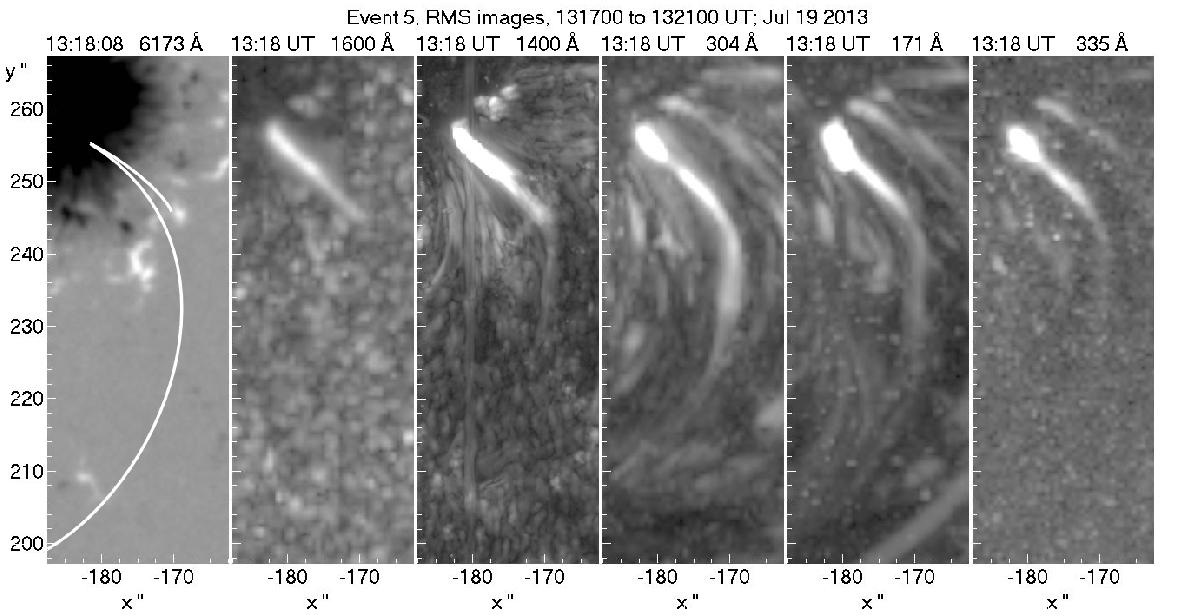
HMI magnetogram and images of the root mean square (RMS) of the intensity in five wavelength bands. High intensity regions in the 1400, 304, 171 and 335 Å images have been saturated to show better the low intensity regions associated with the mass flows. White lines are magnetic field lines of force (see text).
Current usage metrics show cumulative count of Article Views (full-text article views including HTML views, PDF and ePub downloads, according to the available data) and Abstracts Views on Vision4Press platform.
Data correspond to usage on the plateform after 2015. The current usage metrics is available 48-96 hours after online publication and is updated daily on week days.
Initial download of the metrics may take a while.