Free Access
Fig. 7
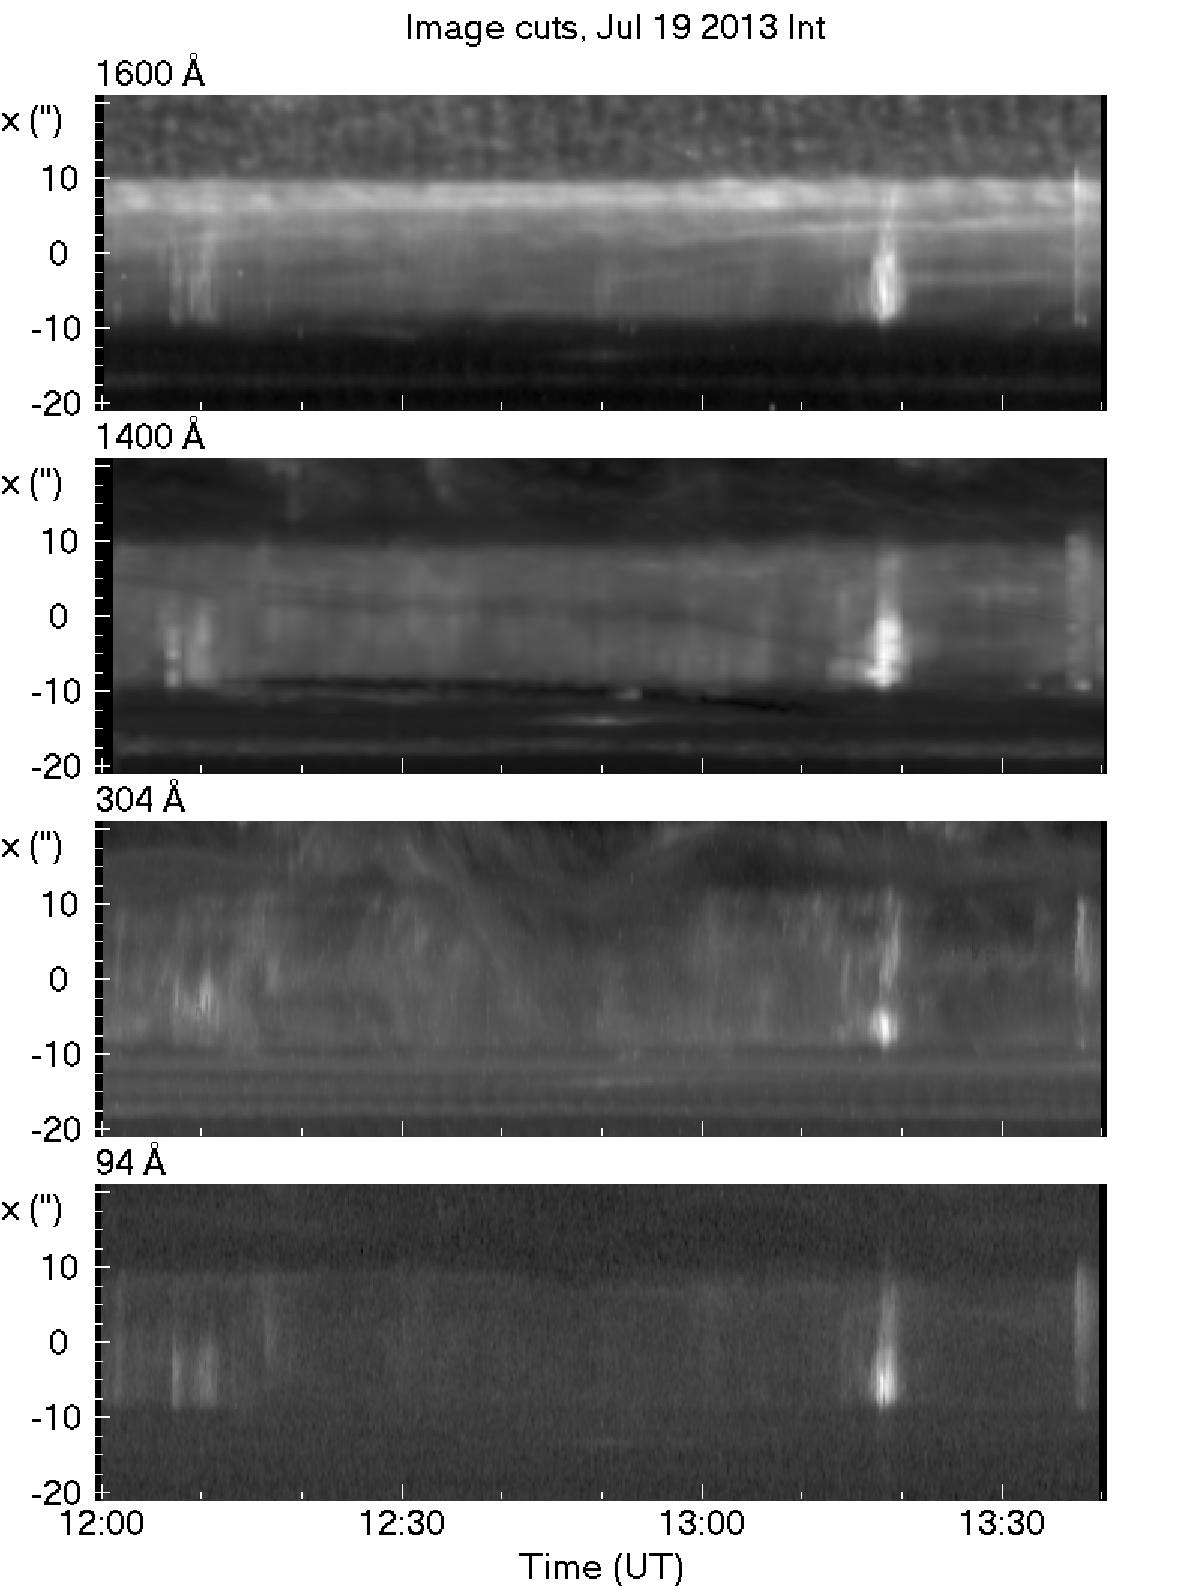
Intensity as a function of time and position along the loop for the entire observing sequence in four wavelength bands. Zero position is near the middle of the brightenings, x increases away from the spot. The spectrograph slit appears as a dark band in the 1400 Å image, shifting from x = 6 to x = −10 during the sequence.
Current usage metrics show cumulative count of Article Views (full-text article views including HTML views, PDF and ePub downloads, according to the available data) and Abstracts Views on Vision4Press platform.
Data correspond to usage on the plateform after 2015. The current usage metrics is available 48-96 hours after online publication and is updated daily on week days.
Initial download of the metrics may take a while.