Free Access
Fig. 6
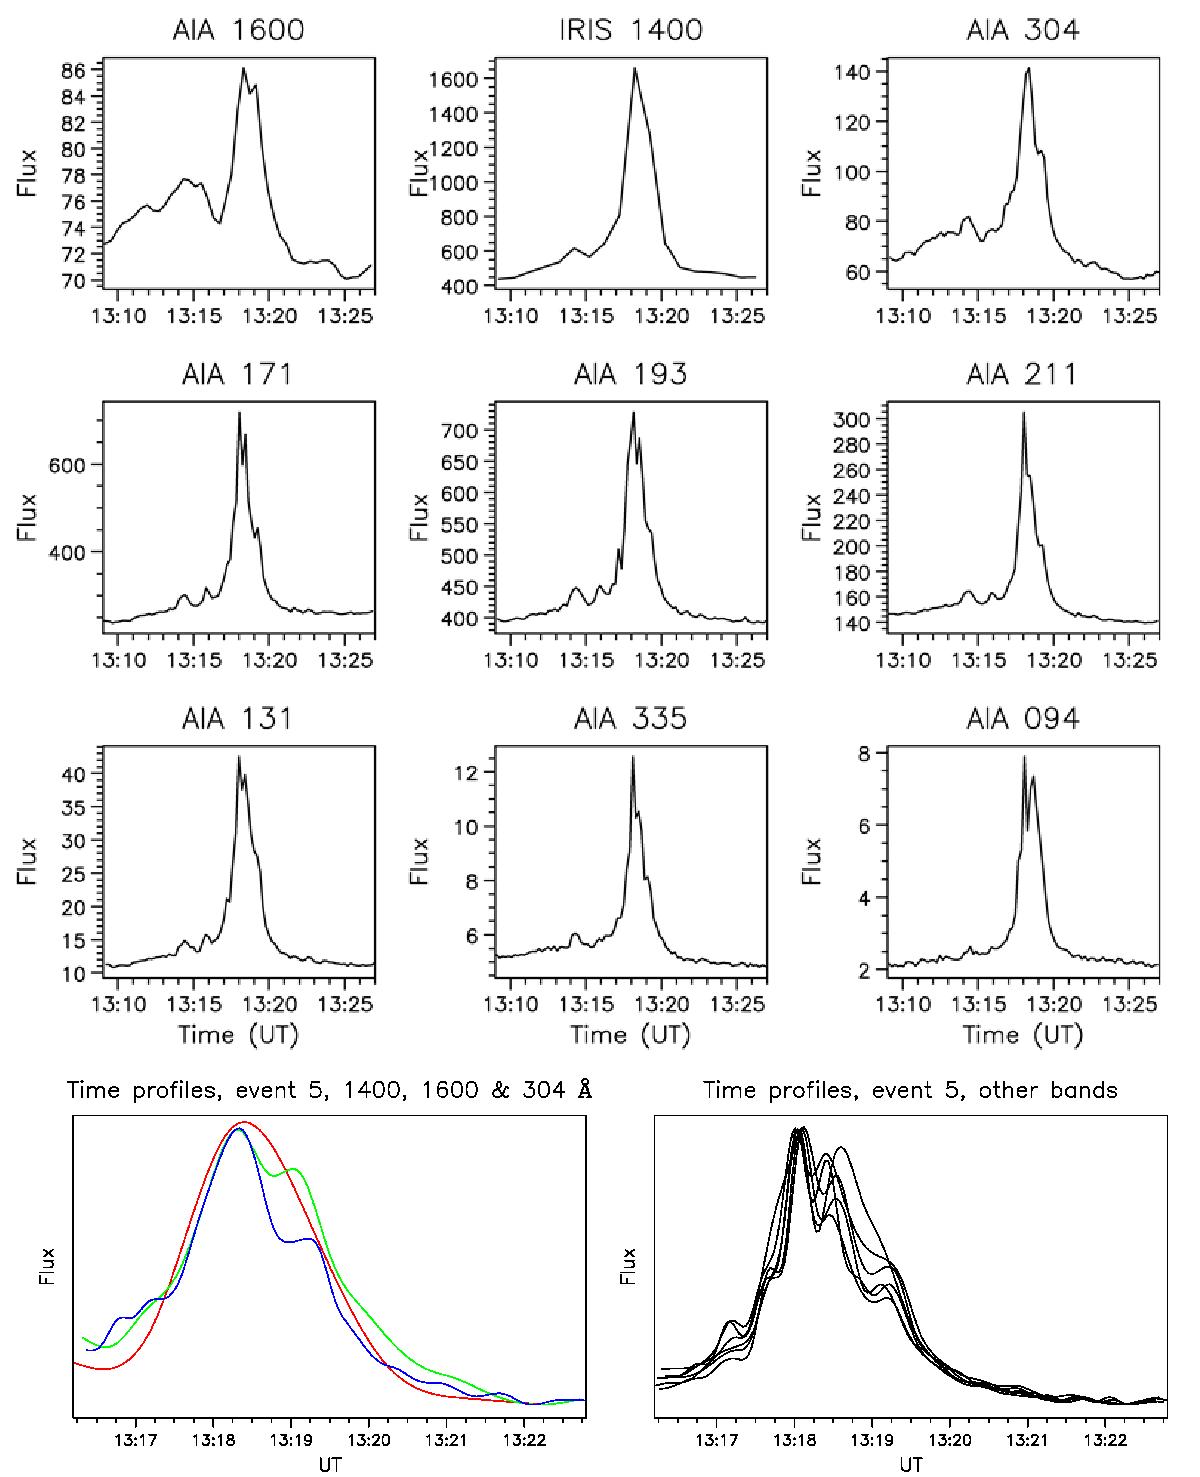
Time profiles of the main event in all wavelength bands (top three rows). The bottom row shows time profiles near the spike in the 1600, 1400 and 304 Å bands (left) and all other bands (right), plotted together and normalized to their respective minima and maxima. Red is for 1400, green for 1600 and blue for 304 Å.
Current usage metrics show cumulative count of Article Views (full-text article views including HTML views, PDF and ePub downloads, according to the available data) and Abstracts Views on Vision4Press platform.
Data correspond to usage on the plateform after 2015. The current usage metrics is available 48-96 hours after online publication and is updated daily on week days.
Initial download of the metrics may take a while.