Fig. 5
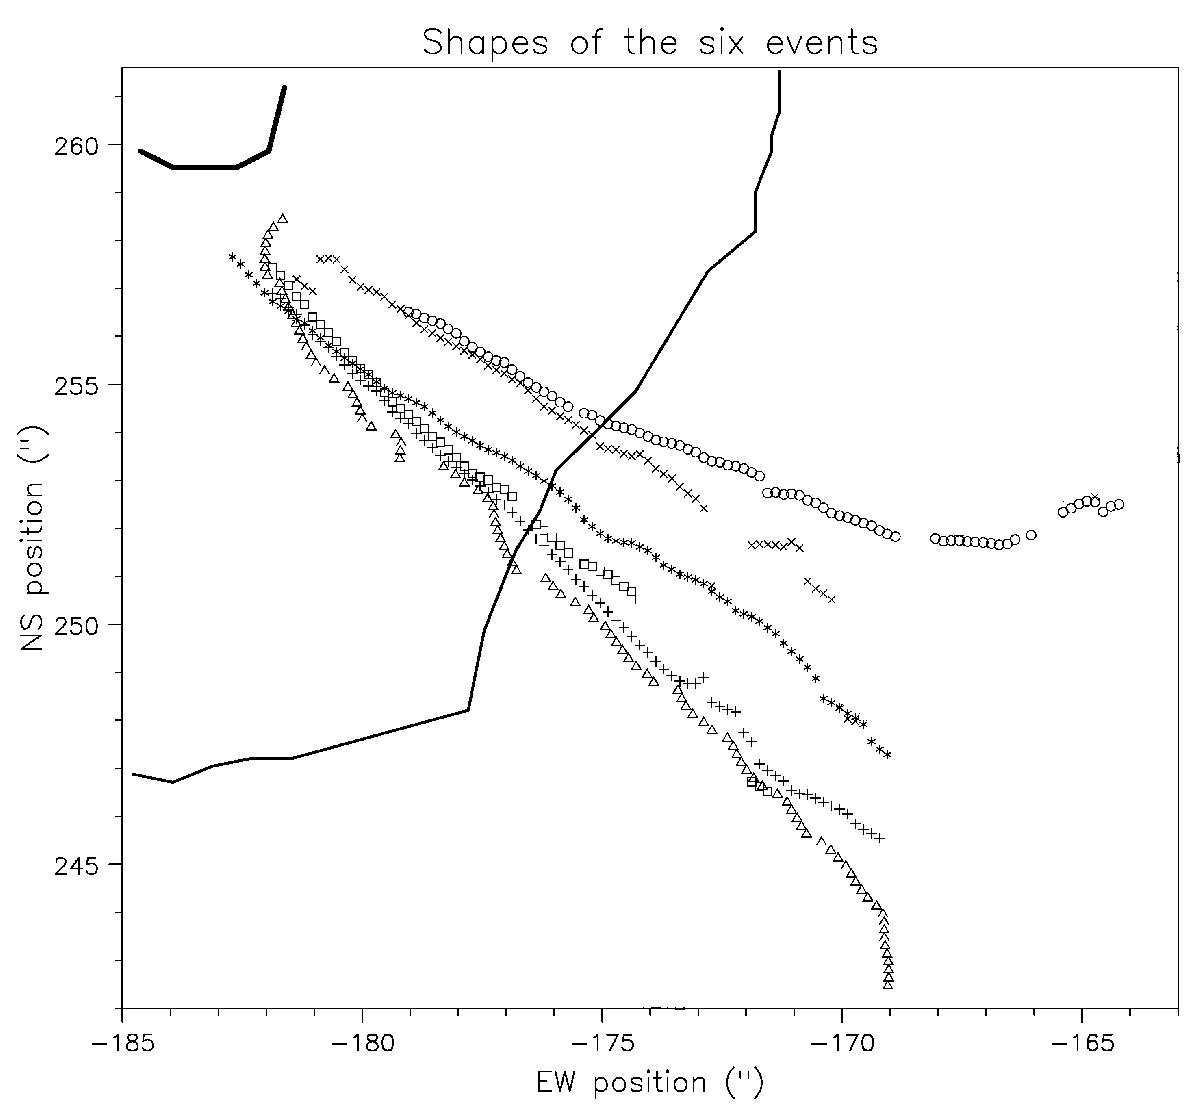
Shapes of the six events, determined from the position of the maximum intensity of their average SJ images in the 1400 Å band and plotted in the EW-NS coordinate system. Asterisks refer to event 1, circles to event 2, x’s to event 3, squares to event 4, pluses to event 5 (the main event) and triangles to event 6. Full lines show the penumbra-chromosphere (thin) and the umbra-penumbra (thick) boundaries, measured from the gradient of the continuum images.
Current usage metrics show cumulative count of Article Views (full-text article views including HTML views, PDF and ePub downloads, according to the available data) and Abstracts Views on Vision4Press platform.
Data correspond to usage on the plateform after 2015. The current usage metrics is available 48-96 hours after online publication and is updated daily on week days.
Initial download of the metrics may take a while.