Fig. 4
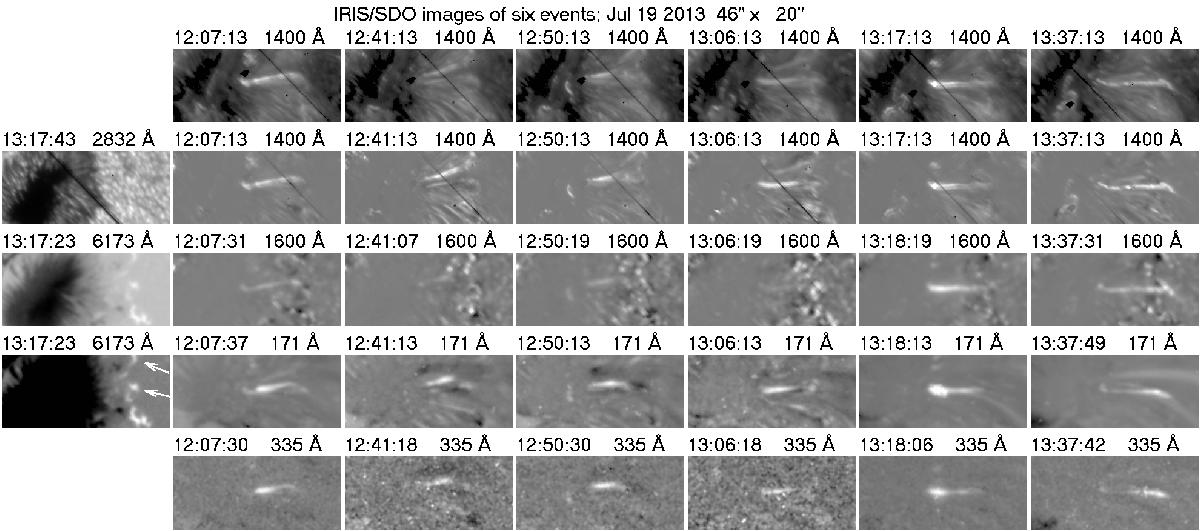
Penumbral brightenings in the IRIS 1400 Å SJ band (top row). The other rows show difference images in the 1400, 1600, 171 and 335 Å bands, normalized to the minimum and maximum intensity for clarity. In the left column we give a 2832 Å continuum image, as well as full-range and saturated magnetograms for reference. The images have been rotated by 44° counter-clockwise.
Current usage metrics show cumulative count of Article Views (full-text article views including HTML views, PDF and ePub downloads, according to the available data) and Abstracts Views on Vision4Press platform.
Data correspond to usage on the plateform after 2015. The current usage metrics is available 48-96 hours after online publication and is updated daily on week days.
Initial download of the metrics may take a while.