Fig. 3
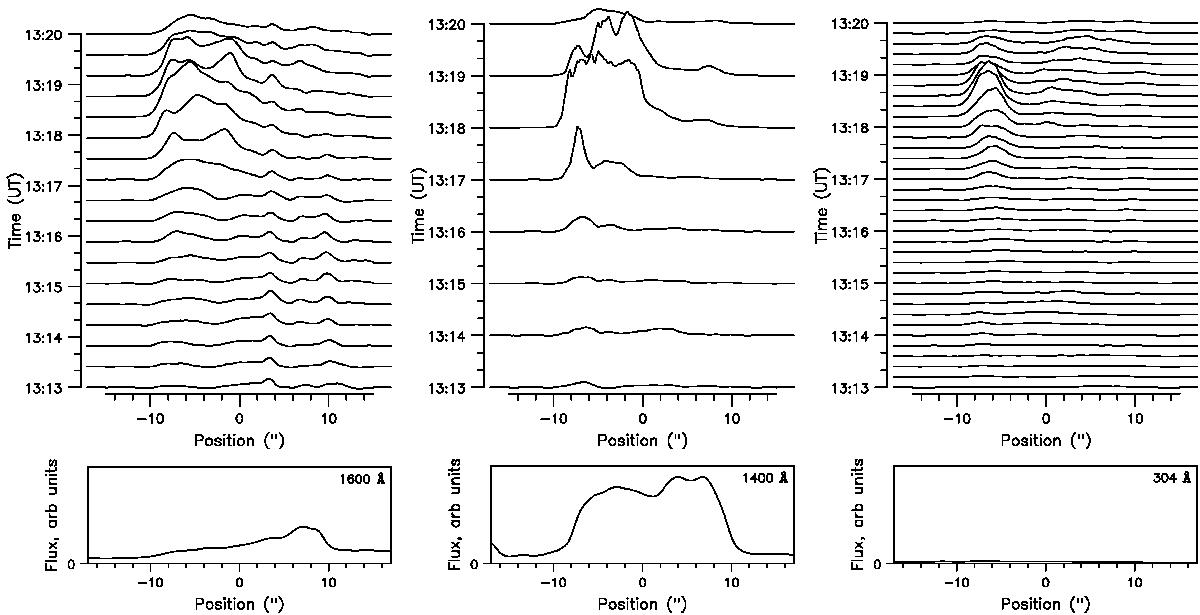
Intensity along the loop integrated in the perpendicular direction as a function of time for the main event at 1600 (left), 1400 (center) and 304 Å (right). The time average, shown in the bottom frames, has been subtracted. At 1400 Å, many points in the 13:18 and some in the 13:17 and 13:19 UT tracings are saturated. Zero position is near the center of the loop.
Current usage metrics show cumulative count of Article Views (full-text article views including HTML views, PDF and ePub downloads, according to the available data) and Abstracts Views on Vision4Press platform.
Data correspond to usage on the plateform after 2015. The current usage metrics is available 48-96 hours after online publication and is updated daily on week days.
Initial download of the metrics may take a while.