Free Access
Fig. A.2
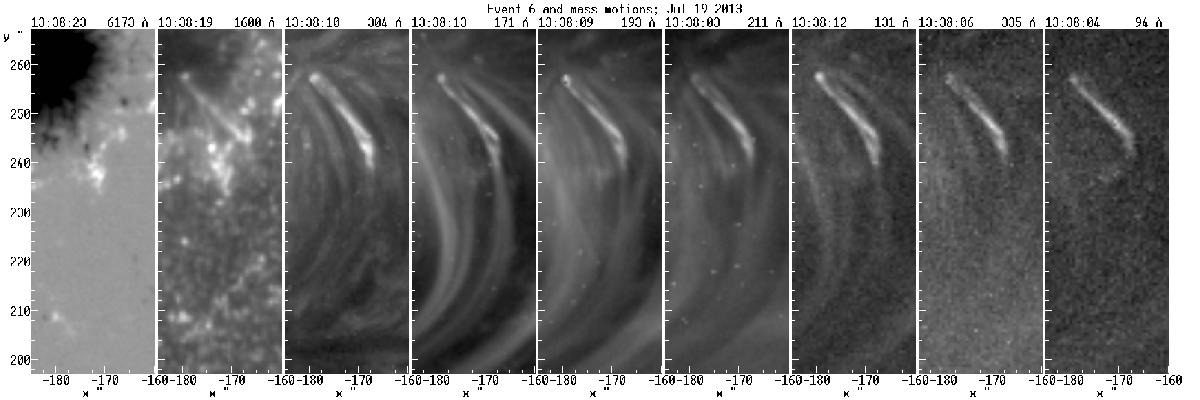
A frame of movie 2, which shows the interaction of the two loops in event 6. From left to right: HMI magnetogram and AIA images in the 1600 Å, 304 Å, 171 Å193 Å, 211 Å, 131 Å, 135 Å, and 94 Å bands.
Current usage metrics show cumulative count of Article Views (full-text article views including HTML views, PDF and ePub downloads, according to the available data) and Abstracts Views on Vision4Press platform.
Data correspond to usage on the plateform after 2015. The current usage metrics is available 48-96 hours after online publication and is updated daily on week days.
Initial download of the metrics may take a while.