Free Access
Fig. 15
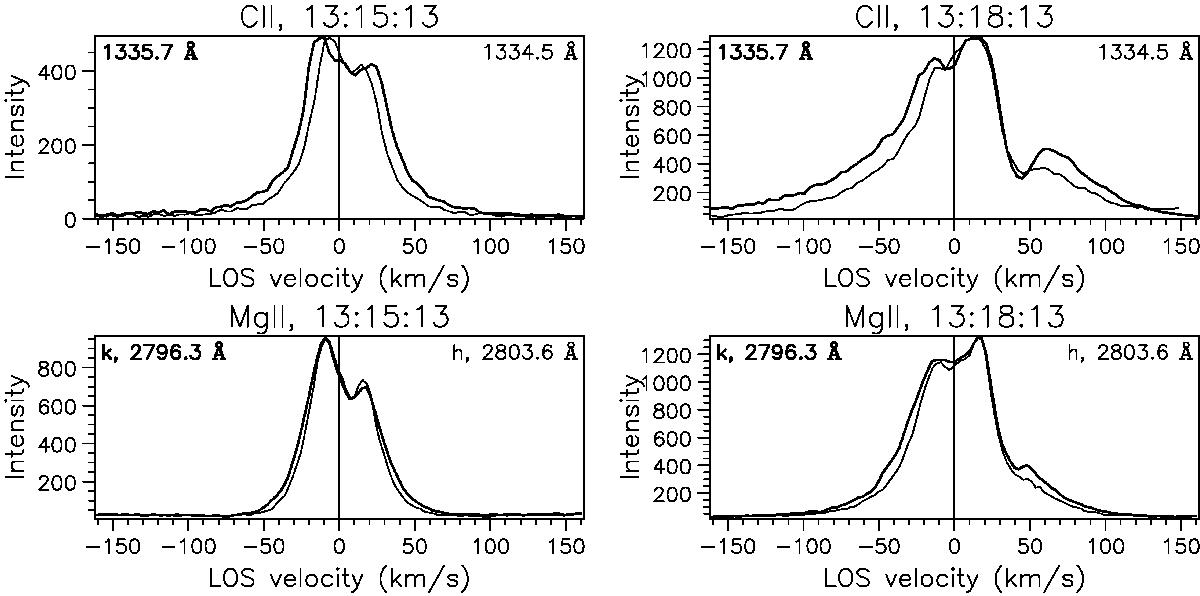
Profiles of C ii (top) and Mg ii (bottom) lines without (left) and with (right) absorption features. The intensity of each profile is scaled so that the plot covers its full range from the bottom to the top. Thick lines show the profiles of the strongest line of the doublet, to which the intensity scale also refers.
Current usage metrics show cumulative count of Article Views (full-text article views including HTML views, PDF and ePub downloads, according to the available data) and Abstracts Views on Vision4Press platform.
Data correspond to usage on the plateform after 2015. The current usage metrics is available 48-96 hours after online publication and is updated daily on week days.
Initial download of the metrics may take a while.