Free Access
Fig. 14
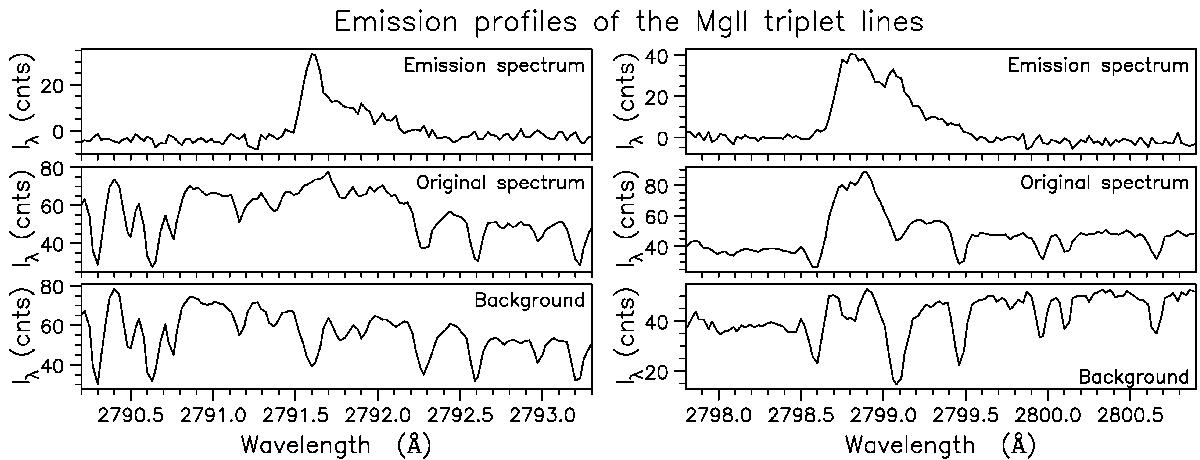
Emission profiles of the Mg ii triplet lines at 2791.6 Å (left) and 2798.8 Å (right) at 13:18:43 UT. The plots show the background spectrum (lower row) and the spectrum through the feature before (middle row) and after (top row) background subtraction.
Current usage metrics show cumulative count of Article Views (full-text article views including HTML views, PDF and ePub downloads, according to the available data) and Abstracts Views on Vision4Press platform.
Data correspond to usage on the plateform after 2015. The current usage metrics is available 48-96 hours after online publication and is updated daily on week days.
Initial download of the metrics may take a while.