Free Access
Fig. 13
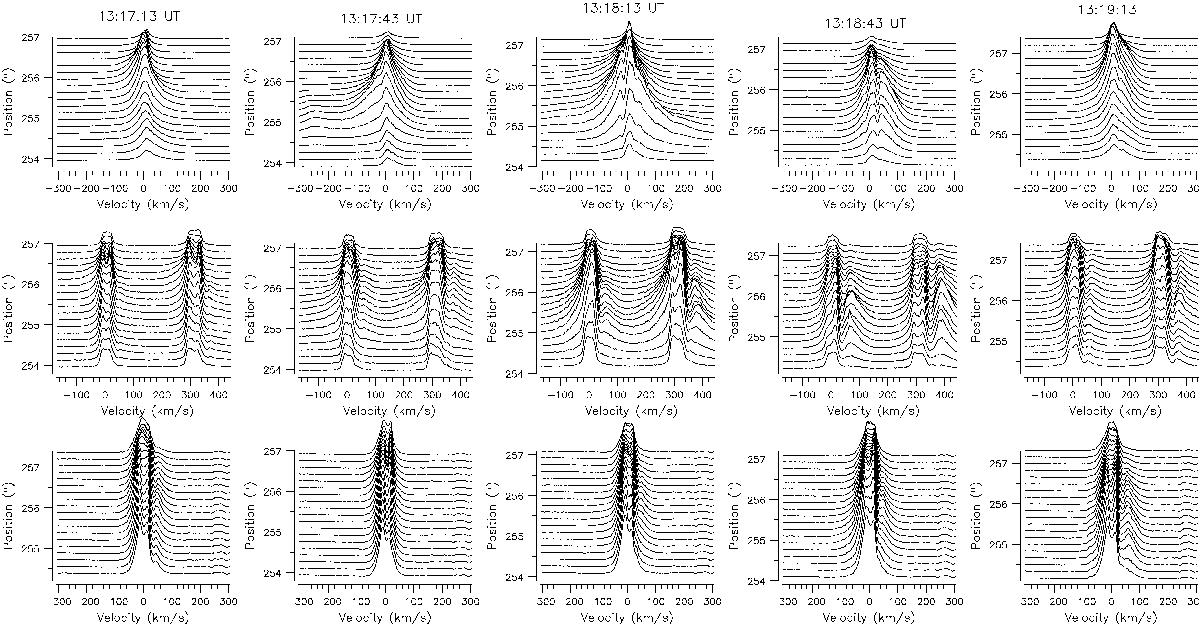
Profiles of Si iv 1393.8 Å (top), C ii 1334.6 Å (center) and Mg ii k (bottom) lines during the main event. Time is marked above each Si iv spectrum. The intensity scale is the same for all profiles of the same line.
Current usage metrics show cumulative count of Article Views (full-text article views including HTML views, PDF and ePub downloads, according to the available data) and Abstracts Views on Vision4Press platform.
Data correspond to usage on the plateform after 2015. The current usage metrics is available 48-96 hours after online publication and is updated daily on week days.
Initial download of the metrics may take a while.