Fig. 12
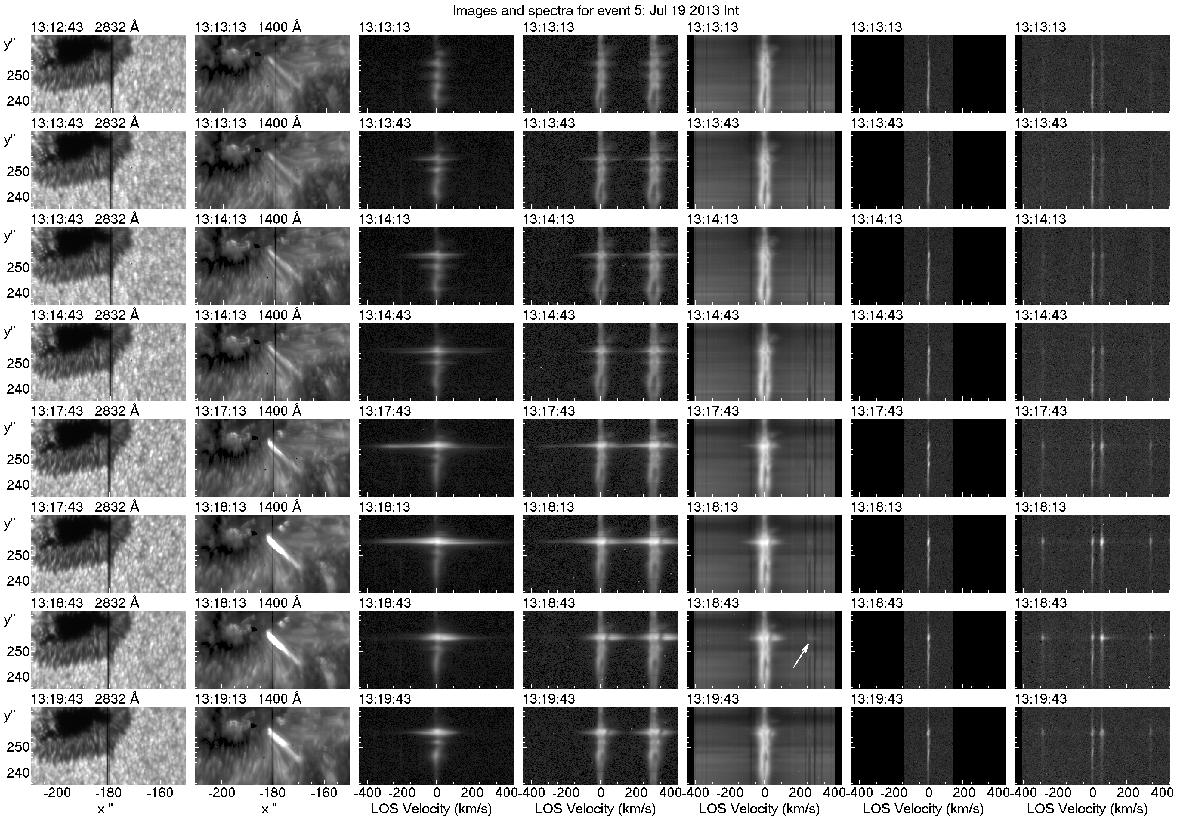
IRIS SJ images in the 2832 and 1400 Å bands and spectra of Si iv 1393.8 Å, C ii doublet (centered at the 1334.6 Å line), Mg ii k, 1351.7 Å Cl i and the O i 1355.6 Å–C i 1355.8 Å lines during the main event. Missing SJ images, due to their lower cadence, are replaced by the previous ones. The arrow points to a weak emission from the Mg ii triplet line. The wavelength is expressed in terms of the line-of-sight velocity, with the origin at the line center. The images and the spectra in each column are displayed with the same intensity scale. For a more complete sequence see the movie attached to Fig. A.3.
Current usage metrics show cumulative count of Article Views (full-text article views including HTML views, PDF and ePub downloads, according to the available data) and Abstracts Views on Vision4Press platform.
Data correspond to usage on the plateform after 2015. The current usage metrics is available 48-96 hours after online publication and is updated daily on week days.
Initial download of the metrics may take a while.