Fig. 11
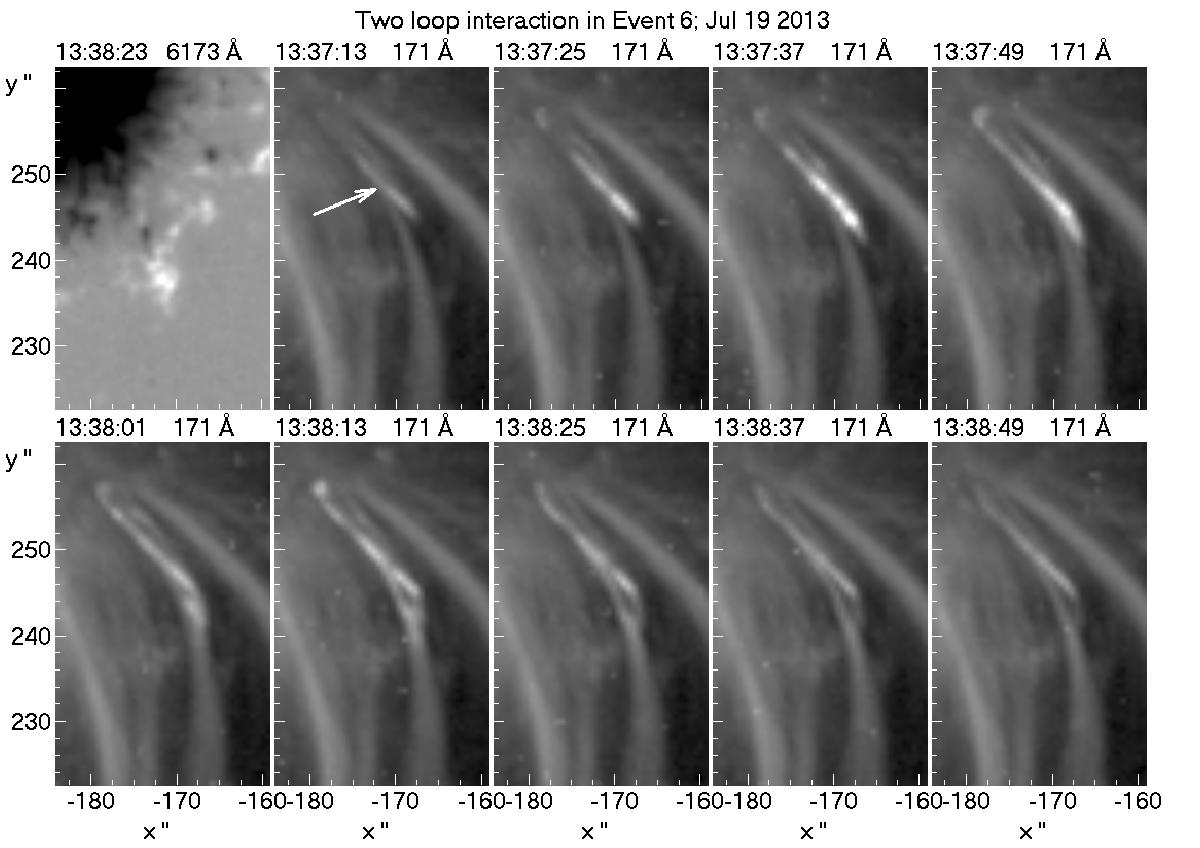
Two-loop interaction and mass flows in Event 6 in 171 Å AIA images; an HMI magnetogram is given for reference. The arrow points to the intersection of the projections on the plane of the sky of the high and low loops. The full sequence of images in the 1600, 1400, 304, 171 and 335 Å bands is given in the movie attached to Fig. A.2.
Current usage metrics show cumulative count of Article Views (full-text article views including HTML views, PDF and ePub downloads, according to the available data) and Abstracts Views on Vision4Press platform.
Data correspond to usage on the plateform after 2015. The current usage metrics is available 48-96 hours after online publication and is updated daily on week days.
Initial download of the metrics may take a while.