Fig. 6
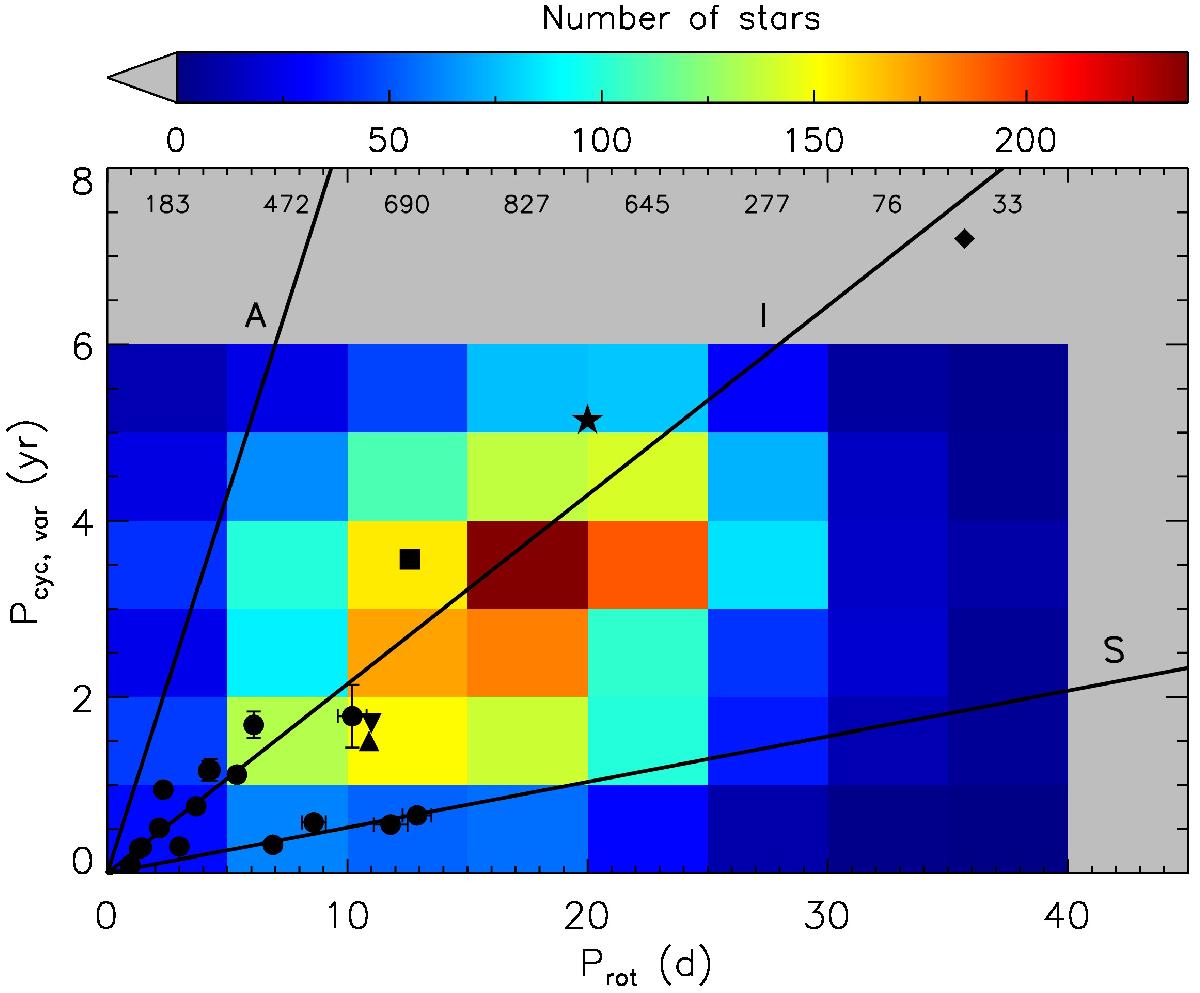
Distribution of periodic stars with FAP < 5% in the Prot−Pcyc, var plane; the gray area indicates the limits of our detection reliability. The different black symbols represent cycle period measurements from other authors: circles: Ferreira Lopes et al. (2015), upside down triangle: Egeland et al. (2015), normal triangle: Salabert et al. (2016), square: Moutou et al. (2016), star: Flores et al. (2016), and diamond: Boro Saikia et al. (2016). The solid black lines show the active (A), inactive (I), and short-cycle (S) sequences as defined by Ferreira Lopes et al. (2015). The numbers above the color bins denote the total number of stars in each column.
Current usage metrics show cumulative count of Article Views (full-text article views including HTML views, PDF and ePub downloads, according to the available data) and Abstracts Views on Vision4Press platform.
Data correspond to usage on the plateform after 2015. The current usage metrics is available 48-96 hours after online publication and is updated daily on week days.
Initial download of the metrics may take a while.