Fig. 5
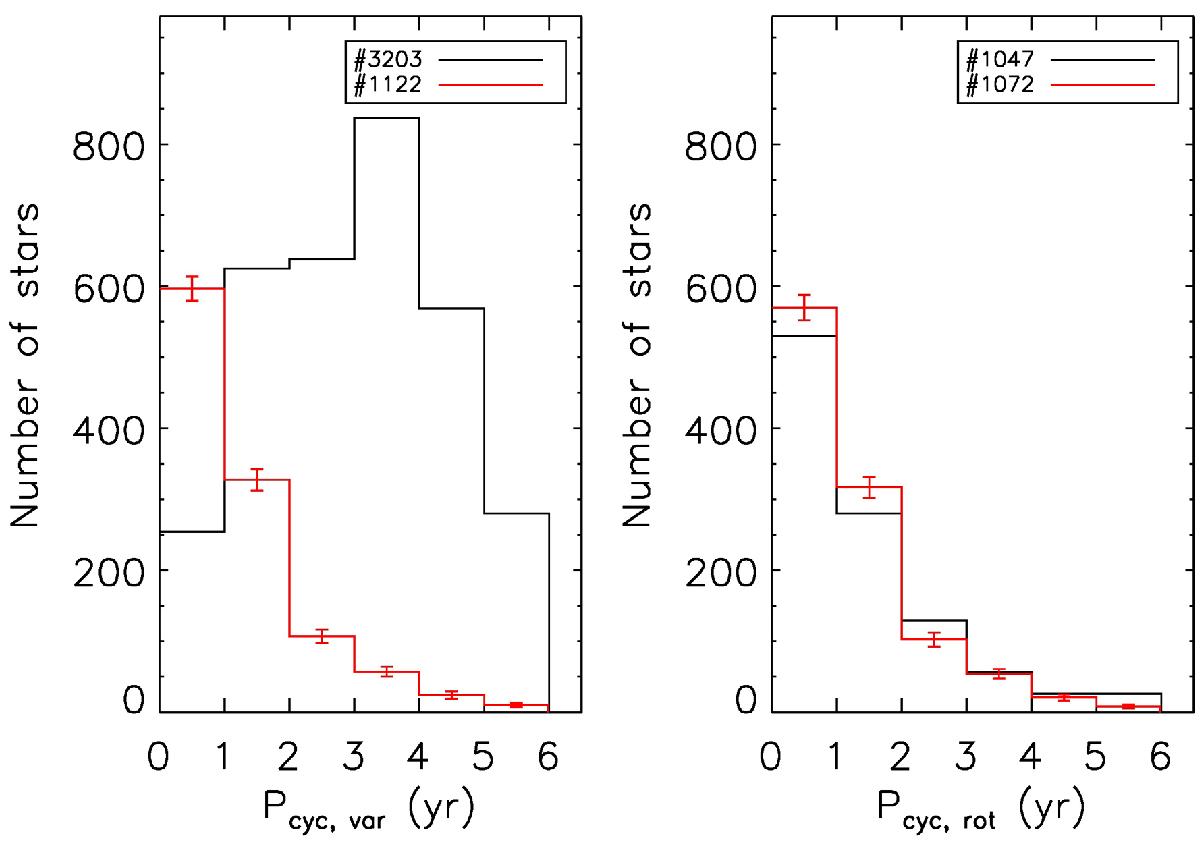
Left panel: distribution of cycle periods Pcyc, var derived from all time series Rvar which satisfied our selection criterion FAP < 5%. The black distribution shows all cases where random permutations of time series Rvar yielded a higher peak in the Lomb-Scargle periodogram than the original time series in less than 5% of all cases. The red curve shows the results from a Monte Carlo experiment where the analysis was performed on random permutations of each Rvar time series for the whole sample. Error bars are based on the Monte Carlo simulations and show one standard deviation. Right panel: distribution of Pcyc, rot, the cycle period determined from variations in the determined rotation periods Prot, satisfying the selection criterion of FAP < 5%. Again the black histogram shows the cycle period distribution of the 5% strongest periodicity data, and the red curve shows the period distribution obtained from the Monte Carlo experiments.
Current usage metrics show cumulative count of Article Views (full-text article views including HTML views, PDF and ePub downloads, according to the available data) and Abstracts Views on Vision4Press platform.
Data correspond to usage on the plateform after 2015. The current usage metrics is available 48-96 hours after online publication and is updated daily on week days.
Initial download of the metrics may take a while.