Fig. 3
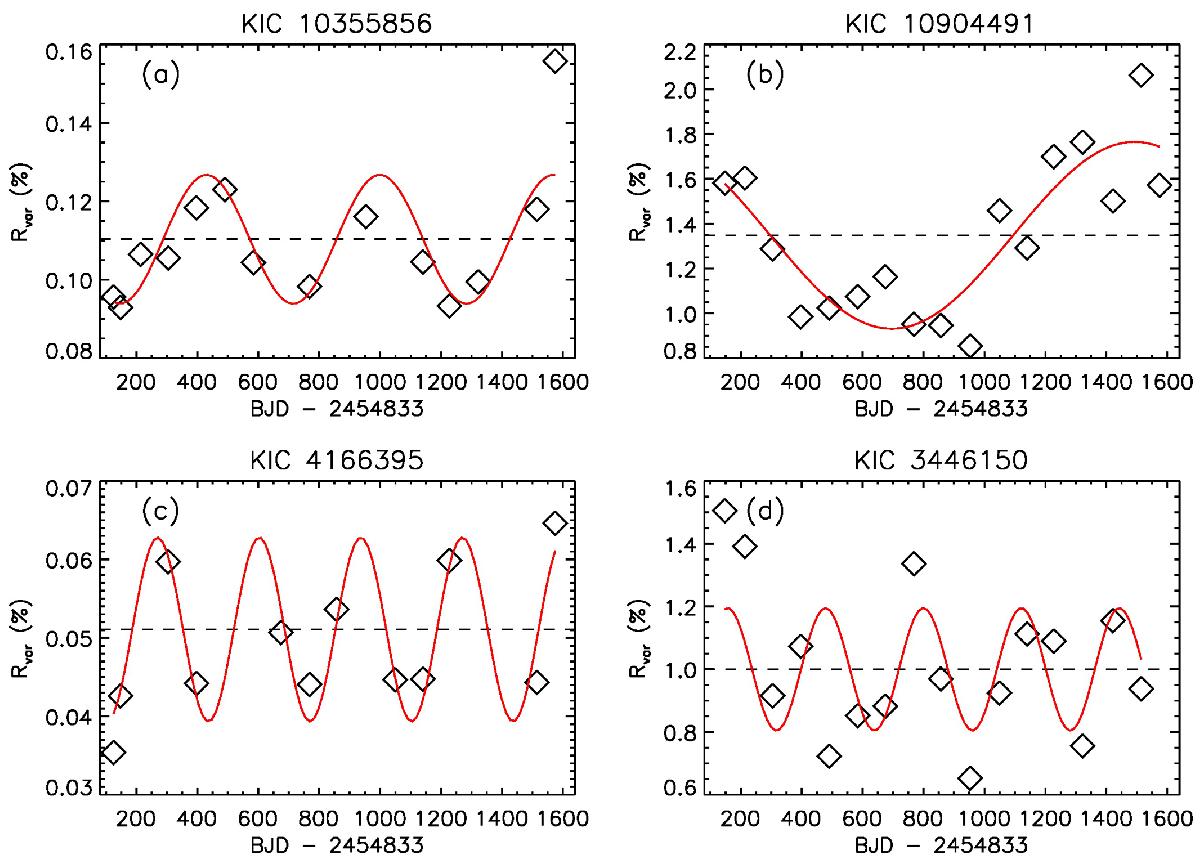
Time series Rvar(t) of the quarterly measured variability ranges of four Kepler stars. The time series in panels a)–c) pass our selection criterion that randomly permuting the time series Rvar of this star yields a higher peak in the Lomb-Scargle periodogram in less than 5% of all tested cases (FAP < 5%), whereas panel d) shows a time series with (FAP > 5%). The red curve shows the best sine fit to the data, and the dashed black line indicates the mean variability of the star. The Rvar(t) time series shown in panels a)–d) exhibit false alarm probabilities FAP = 1.0%, FAP = 0.5%, FAP = 0.3%, and FAP = 17.9%, respectively.
Current usage metrics show cumulative count of Article Views (full-text article views including HTML views, PDF and ePub downloads, according to the available data) and Abstracts Views on Vision4Press platform.
Data correspond to usage on the plateform after 2015. The current usage metrics is available 48-96 hours after online publication and is updated daily on week days.
Initial download of the metrics may take a while.