Fig. 2
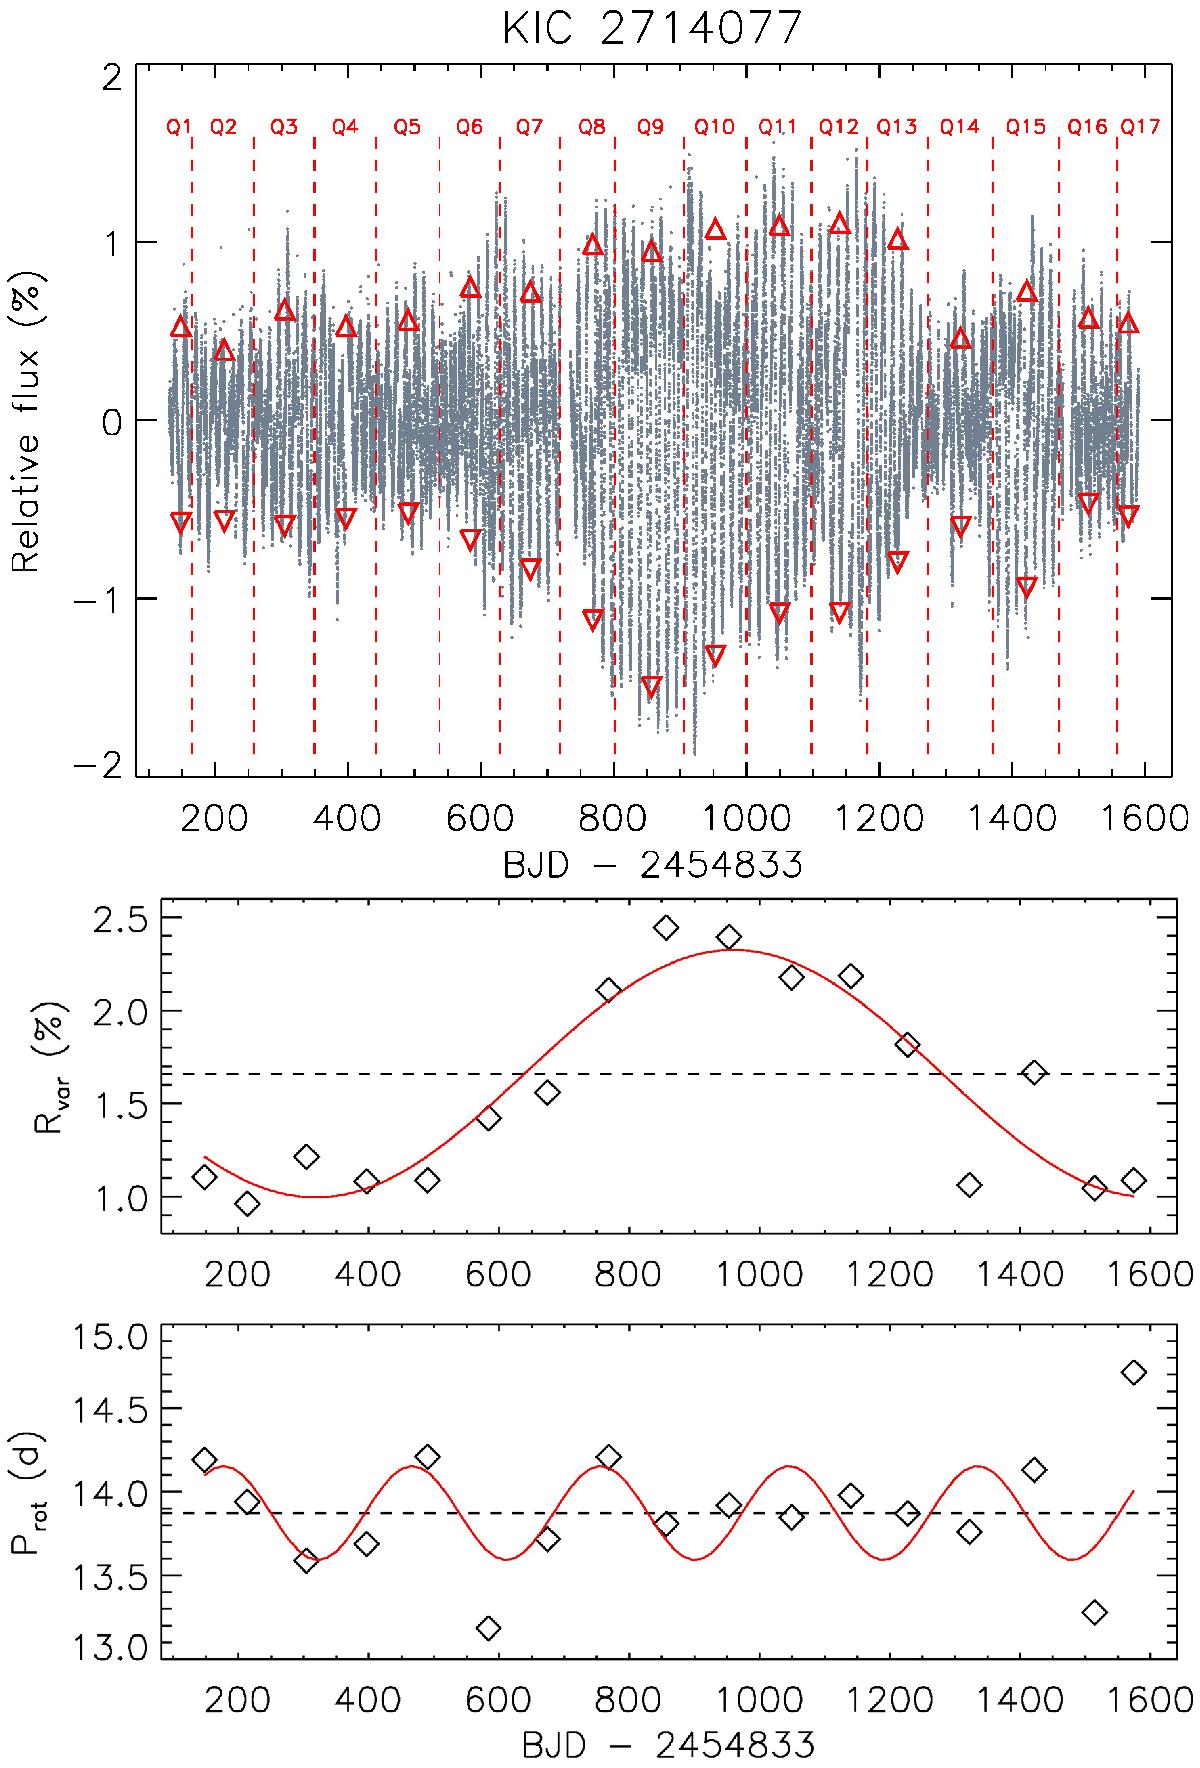
Upper panel: Kepler light curve of the star KIC 2714077. Vertical red lines indicate the quarters Q1-Q17. Red triangles at the bottom and the top show the 5th and 95th percentile of the intensity, respectively. For each quarter we measure the intensity difference between the upper and the lower triangle, which equals Rvar. Middle panel: time series of the variability range Rvar(t) of the same star, defined as the difference between the 5th and 95th percentiles in each quarter. Lower panel: time series of the rotation periods Prot(t) of the same star. The red curve in the middle and lower panels show the best sine fit to the Rvar(t) and Prot(t) time series, respectively.
Current usage metrics show cumulative count of Article Views (full-text article views including HTML views, PDF and ePub downloads, according to the available data) and Abstracts Views on Vision4Press platform.
Data correspond to usage on the plateform after 2015. The current usage metrics is available 48-96 hours after online publication and is updated daily on week days.
Initial download of the metrics may take a while.