Fig. 1
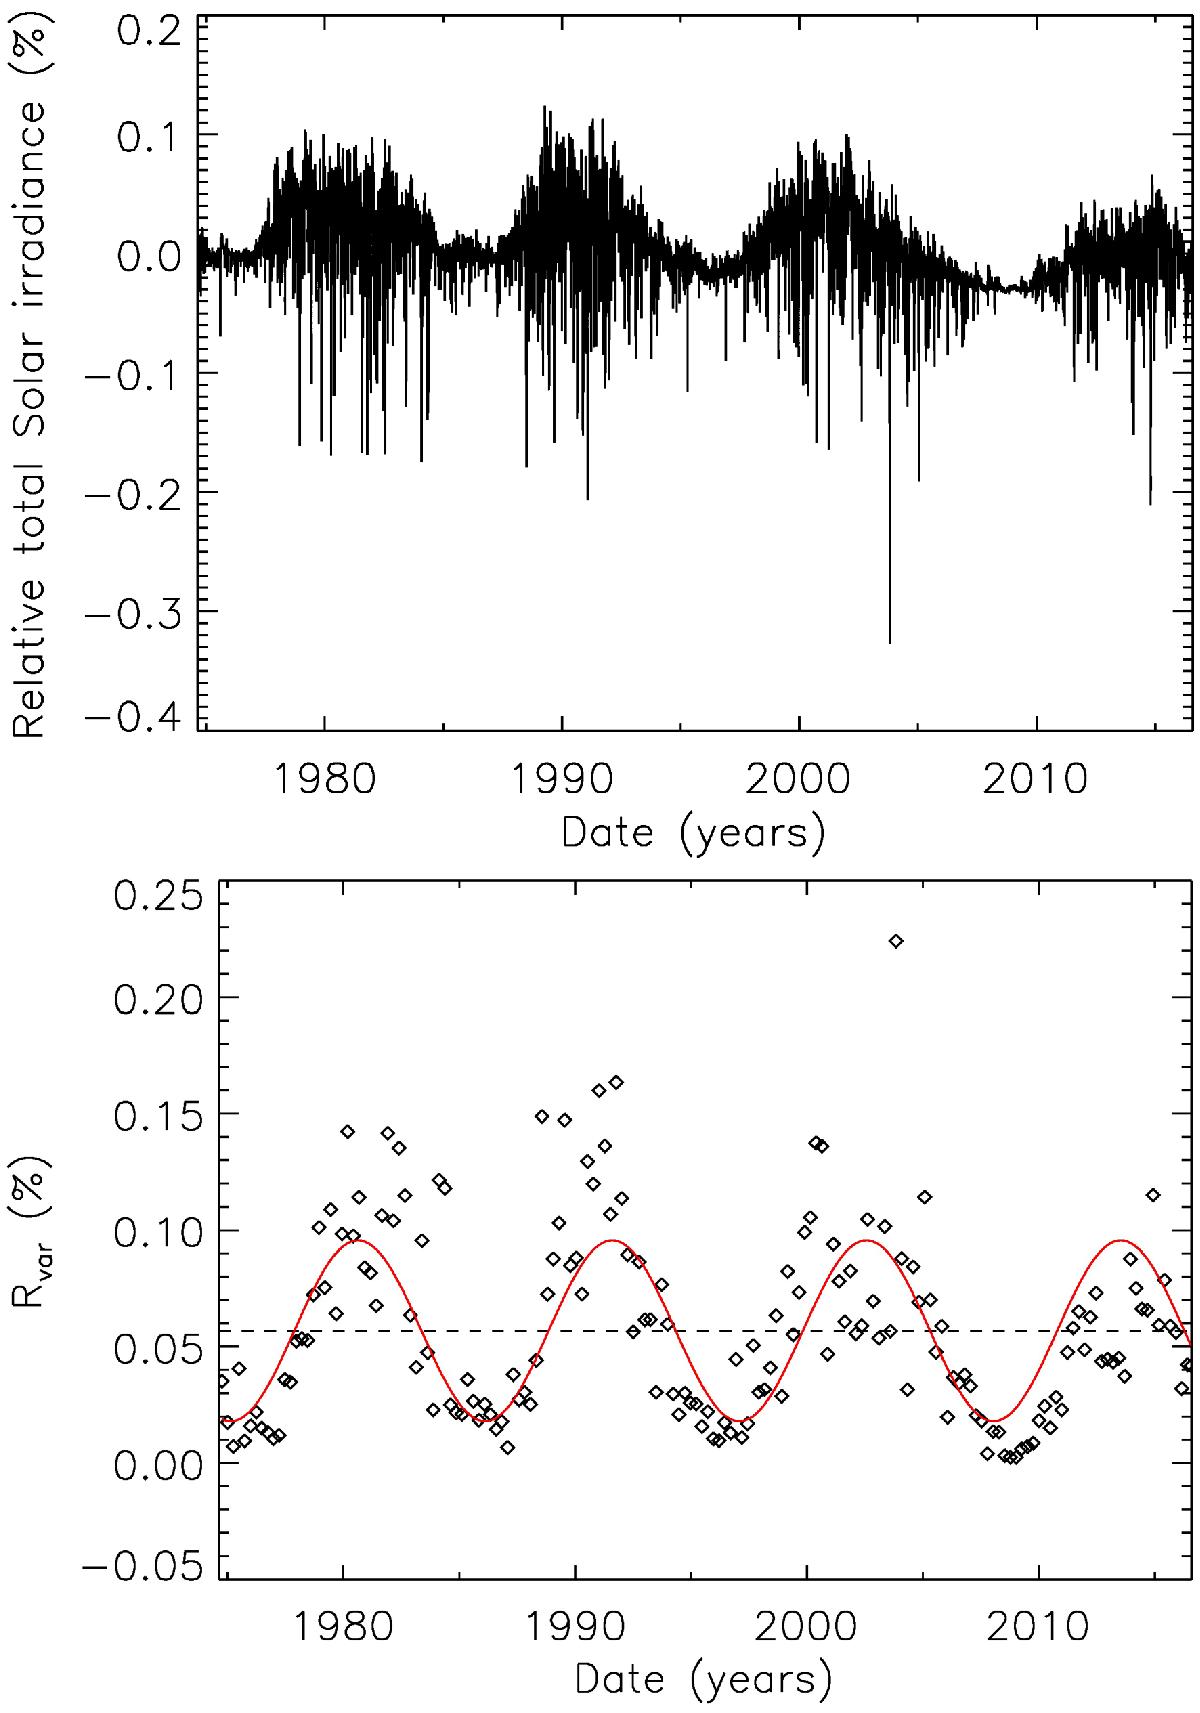
Upper panel: measured total solar irradiance, binned in 1-day intervals, covering more than 40 yr of observations. The approximately 11-year solar cycle can be seen as the Sun’s brightness changes from almost constant during activity minima to highly variable during activity maxima. Lower panel: variability range of the TSI data, Rvar, as a function of time. We define Rvar as the difference between the 5th and 95th percentiles of the 1-day binned intensity in each 90-day period in time. The red curve shows a sine fit to the Rvar time series with a period Pcyc, var = 10.98 ± 0.26 yr.
Current usage metrics show cumulative count of Article Views (full-text article views including HTML views, PDF and ePub downloads, according to the available data) and Abstracts Views on Vision4Press platform.
Data correspond to usage on the plateform after 2015. The current usage metrics is available 48-96 hours after online publication and is updated daily on week days.
Initial download of the metrics may take a while.