Fig. 5
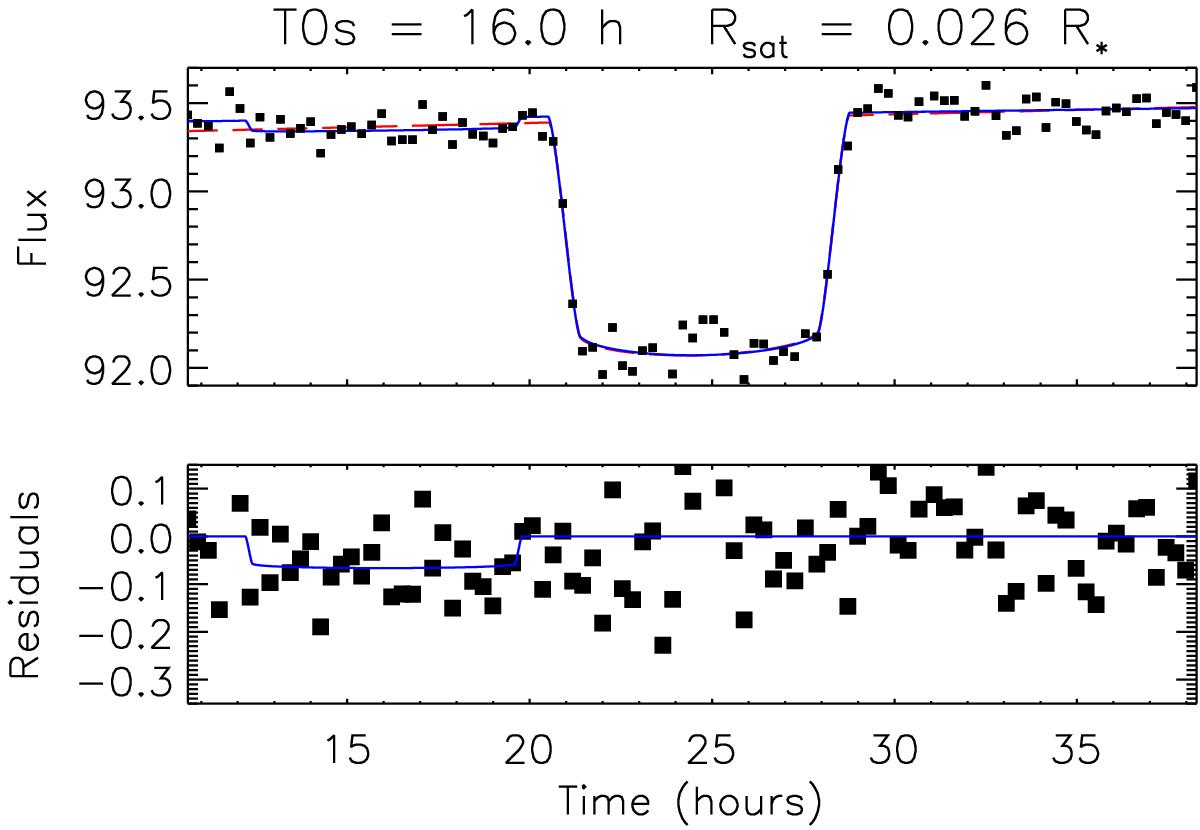
Light curve of the transit on June 18, 2010, and the fit including a satellite with a radius of 0.026 times the planet radius, and with a central time of transit 16.0 h after June 17, 2010, 0h00 UT (blue solid line). This fit has a χ2 of 3162.4, that is smaller by ~6.4 than the χ2 = 3168.8 of the fit without a satellite. The data have been rebinned by 31 into 100 individual measurements. The red dashed line shows the transit model without a satellite. The model light curve with the satellite has an additional occultation starting at about 12 h and ending at about 20 h. The bottom panel shows the residuals of the data (filled squares) and the light curve of the model including the satellite, after subtraction of the best fit without a satellite.
Current usage metrics show cumulative count of Article Views (full-text article views including HTML views, PDF and ePub downloads, according to the available data) and Abstracts Views on Vision4Press platform.
Data correspond to usage on the plateform after 2015. The current usage metrics is available 48-96 hours after online publication and is updated daily on week days.
Initial download of the metrics may take a while.