Fig. 3
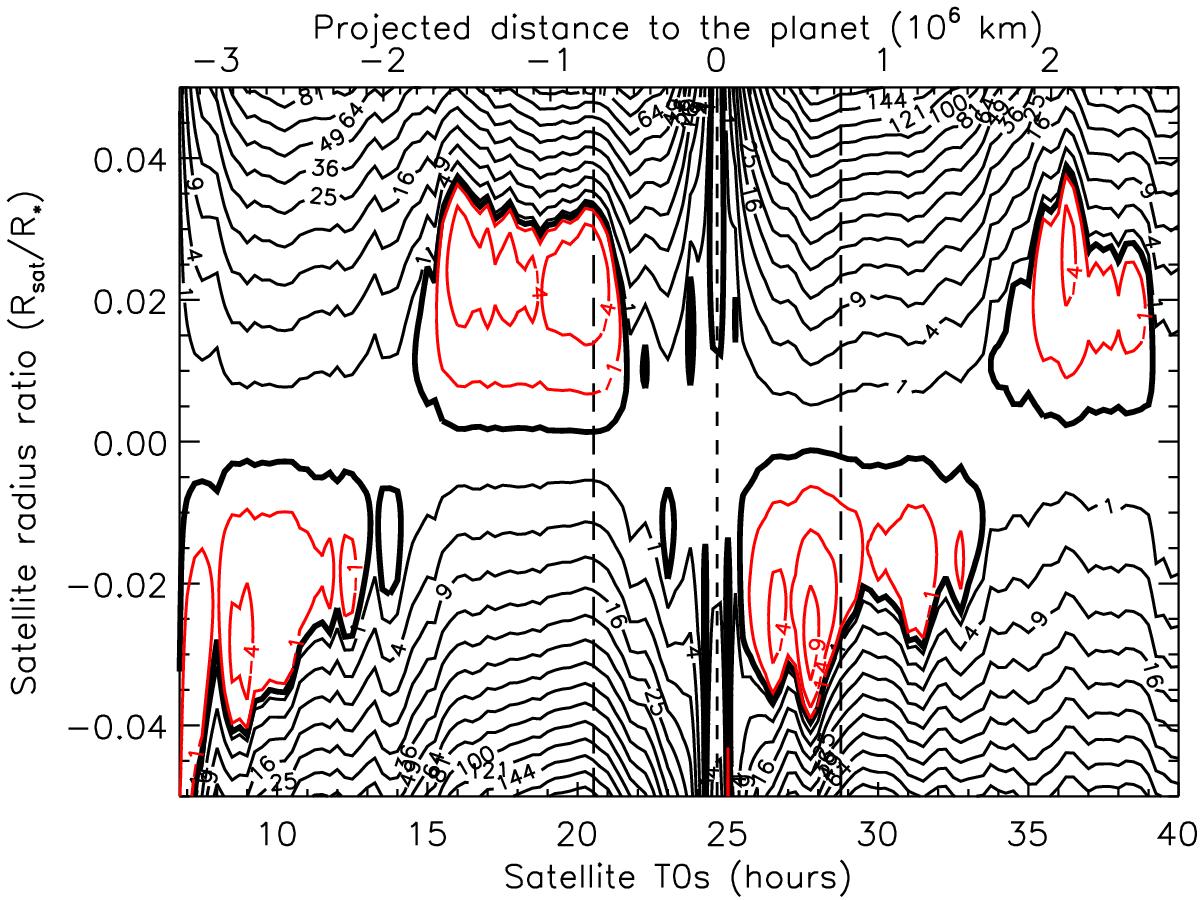
Difference of the χ2 between the best fit with a satellite and without a satellite as a function of the satellite size and central time of transit, measured in the light curve of the 2010 transit. The red iso-curves are for negative values of Δχ2, where the fit with a satellite is better than the fit without satellite. The vertical lines show the central time (short-dashed) and the time of first and fourth contact (long-dashed lines) for the transit of the planet. The upper x-axis provides the projected distance of the satellite to the planet (elongation) for the corresponding central time of the satellite transit (T0s).
Current usage metrics show cumulative count of Article Views (full-text article views including HTML views, PDF and ePub downloads, according to the available data) and Abstracts Views on Vision4Press platform.
Data correspond to usage on the plateform after 2015. The current usage metrics is available 48-96 hours after online publication and is updated daily on week days.
Initial download of the metrics may take a while.