Fig. 9
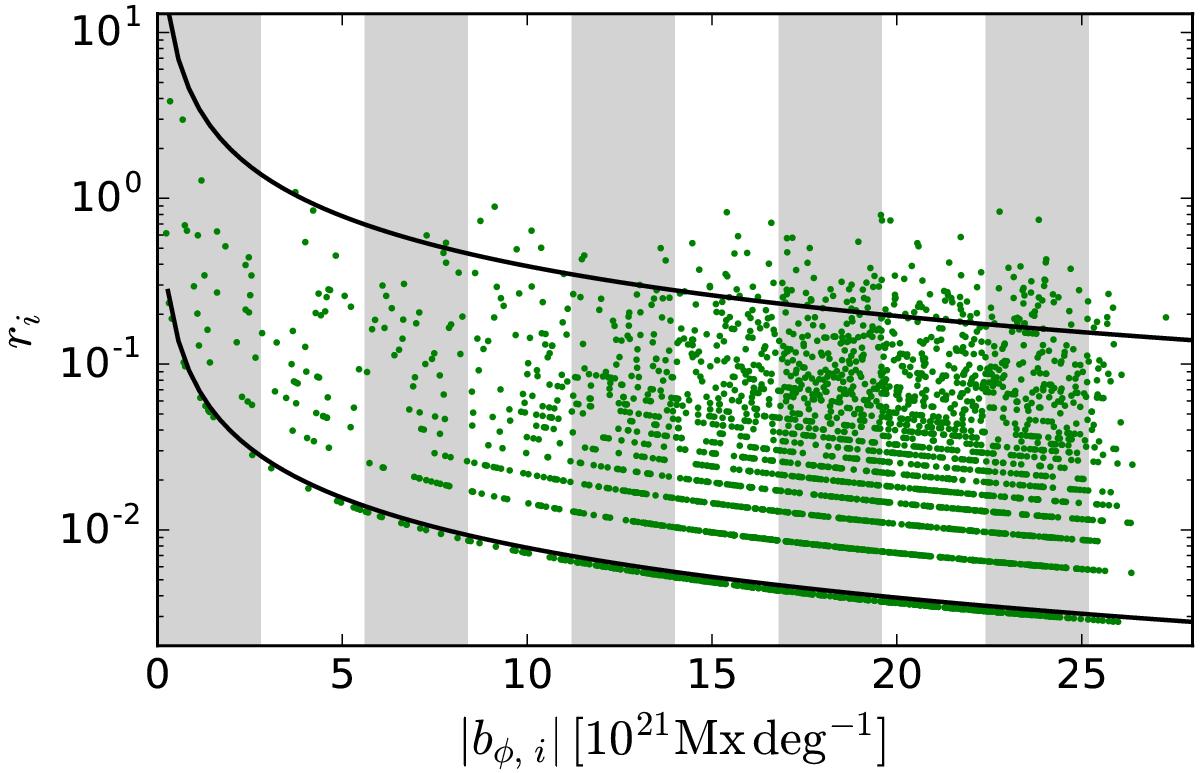
Ratio of the emerged flux to the underlying azimuthal flux (ri) versus the azimuthal flux density beneath the emergence location for the active regions recorded during cycle 23. Each green point represents an emergence. The stripes in the background indicate azimuthal flux ranges. The two continuous curves separate ephemeral regions (below the lower curve), medium-sized regions (between the two curves) and large active regions (above the upper curve) by their flux content, according to Table 5.1 of Schrijver & Zwaan (2008). These fluxes have been converted from fluxes as given by Kitt Peak magnetograms to fluxes as given by SOLIS magnetograms by using the cross-calibration constants in Muñoz-Jaramillo et al. (2015).
Current usage metrics show cumulative count of Article Views (full-text article views including HTML views, PDF and ePub downloads, according to the available data) and Abstracts Views on Vision4Press platform.
Data correspond to usage on the plateform after 2015. The current usage metrics is available 48-96 hours after online publication and is updated daily on week days.
Initial download of the metrics may take a while.