Fig. 8
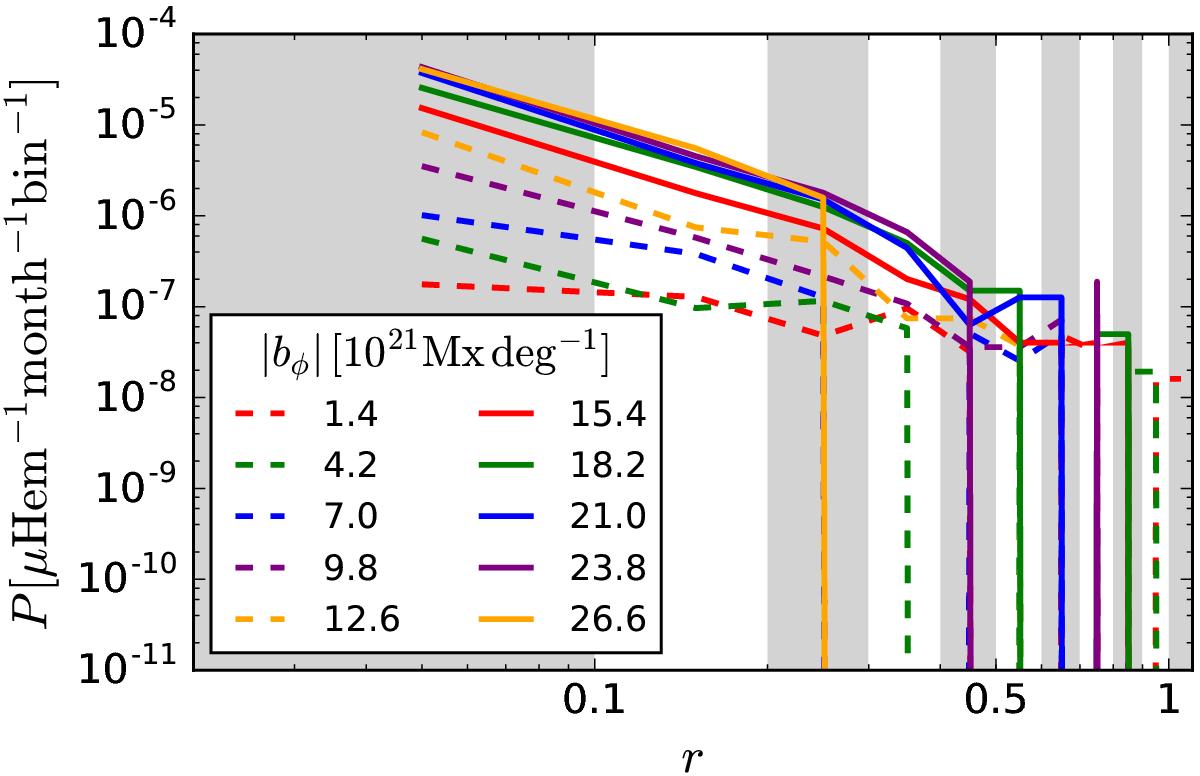
Probability of emergence per unit time, per unit area and per flux ratio bin (P) as a function of the ratio between the emerged flux and the azimuthal flux underlying the emergence site (r). The different colours correspond to the ranges of azimuthal flux density represented in Fig. 7. The numbers in the legend refer to the mid points of the azimuthal flux ranges. The stripes in the background indicate flux ratio bins of width 0.1.
Current usage metrics show cumulative count of Article Views (full-text article views including HTML views, PDF and ePub downloads, according to the available data) and Abstracts Views on Vision4Press platform.
Data correspond to usage on the plateform after 2015. The current usage metrics is available 48-96 hours after online publication and is updated daily on week days.
Initial download of the metrics may take a while.