Free Access
Fig. 7
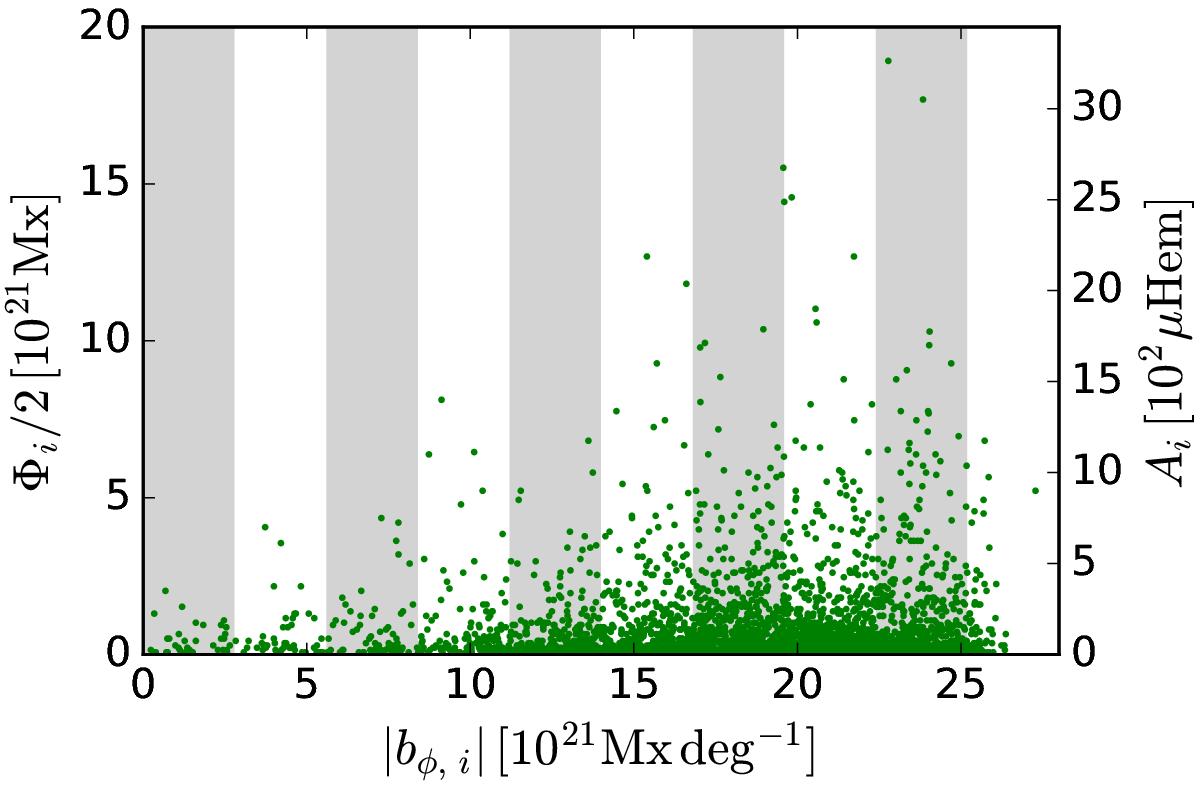
Emerged magnetic flux (Φi) versus underlying azimuthal flux density for the active regions recorded over cycle 23. Each green point represents an emergence. The stripes in the background indicate azimuthal flux density ranges. The area of the emergences is represented on the right-hand-side vertical axis.
Current usage metrics show cumulative count of Article Views (full-text article views including HTML views, PDF and ePub downloads, according to the available data) and Abstracts Views on Vision4Press platform.
Data correspond to usage on the plateform after 2015. The current usage metrics is available 48-96 hours after online publication and is updated daily on week days.
Initial download of the metrics may take a while.