Fig. 6
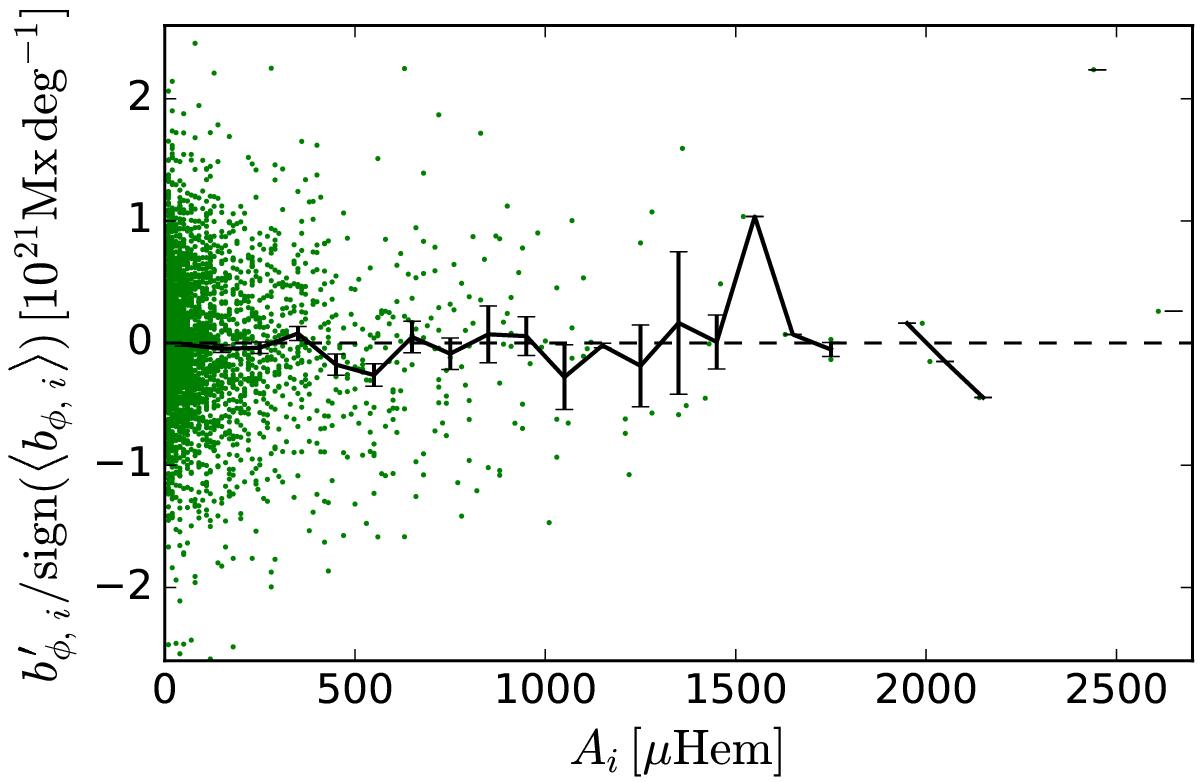
Excess azimuthal flux density above the azimuthal mean underlying each emergence in cycle 23 (![]() ) versus the area of the emergence (Ai). The emergences are represented by green points. The black line represents the average of
) versus the area of the emergence (Ai). The emergences are represented by green points. The black line represents the average of ![]() over all emergences inside area bins of width 100 μHem. The error bars denote the standard error of the mean.
over all emergences inside area bins of width 100 μHem. The error bars denote the standard error of the mean.
Current usage metrics show cumulative count of Article Views (full-text article views including HTML views, PDF and ePub downloads, according to the available data) and Abstracts Views on Vision4Press platform.
Data correspond to usage on the plateform after 2015. The current usage metrics is available 48-96 hours after online publication and is updated daily on week days.
Initial download of the metrics may take a while.