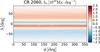
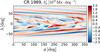
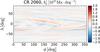
Fig. 4
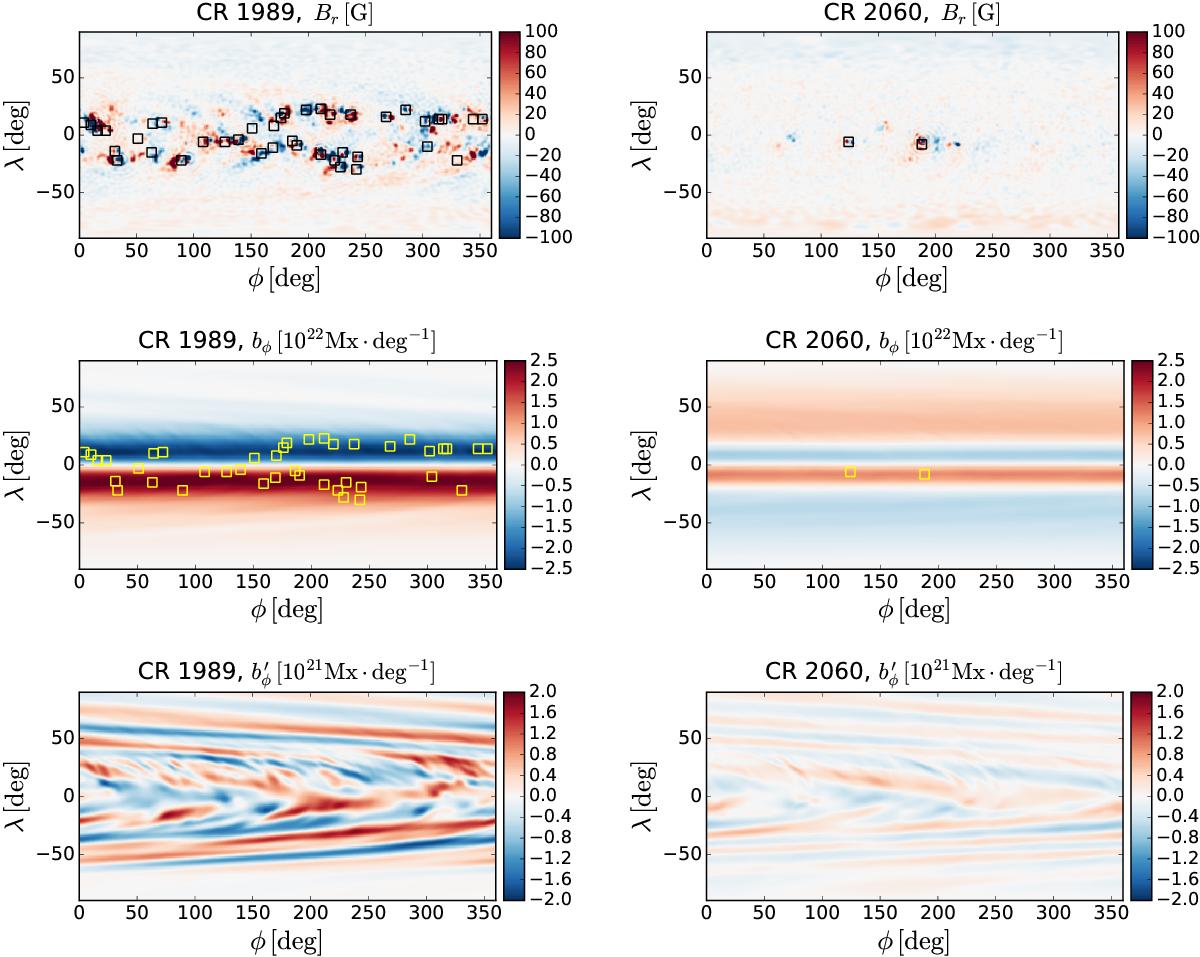
Surface field (Br), azimuthal flux density (bφ) and its non-axisymmetric component (![]() ), for CR 1987 (close to the middle of cycle 23) and CR 2060 (near the end of that cycle). Red and blue represent opposite polarities. The squares on the top and middle rows represent observed emergence sites, extracted from the USAF/NOAA sunspot group database.
), for CR 1987 (close to the middle of cycle 23) and CR 2060 (near the end of that cycle). Red and blue represent opposite polarities. The squares on the top and middle rows represent observed emergence sites, extracted from the USAF/NOAA sunspot group database.
Current usage metrics show cumulative count of Article Views (full-text article views including HTML views, PDF and ePub downloads, according to the available data) and Abstracts Views on Vision4Press platform.
Data correspond to usage on the plateform after 2015. The current usage metrics is available 48-96 hours after online publication and is updated daily on week days.
Initial download of the metrics may take a while.