Fig. 3
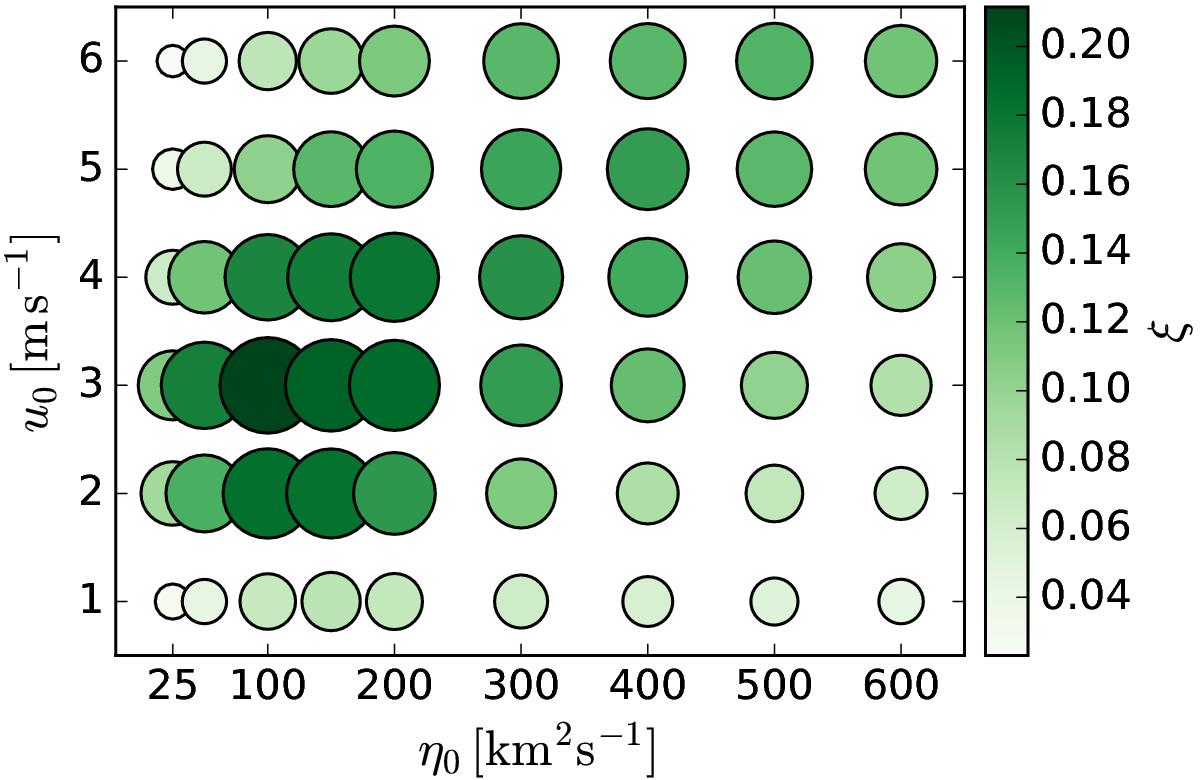
Distribution of the quantity ![]() as a function of the parameters u0 and η0. Each circle represents a run. The size of each circle is proportional to the quantity ξ, which measures the adjustment of the run to our requirement that the simulated azimuthal flux lies underneath the observed active regions. For better visualization, we also encode the value of ξ in the colour of the circles.
as a function of the parameters u0 and η0. Each circle represents a run. The size of each circle is proportional to the quantity ξ, which measures the adjustment of the run to our requirement that the simulated azimuthal flux lies underneath the observed active regions. For better visualization, we also encode the value of ξ in the colour of the circles.
Current usage metrics show cumulative count of Article Views (full-text article views including HTML views, PDF and ePub downloads, according to the available data) and Abstracts Views on Vision4Press platform.
Data correspond to usage on the plateform after 2015. The current usage metrics is available 48-96 hours after online publication and is updated daily on week days.
Initial download of the metrics may take a while.