Fig. 4
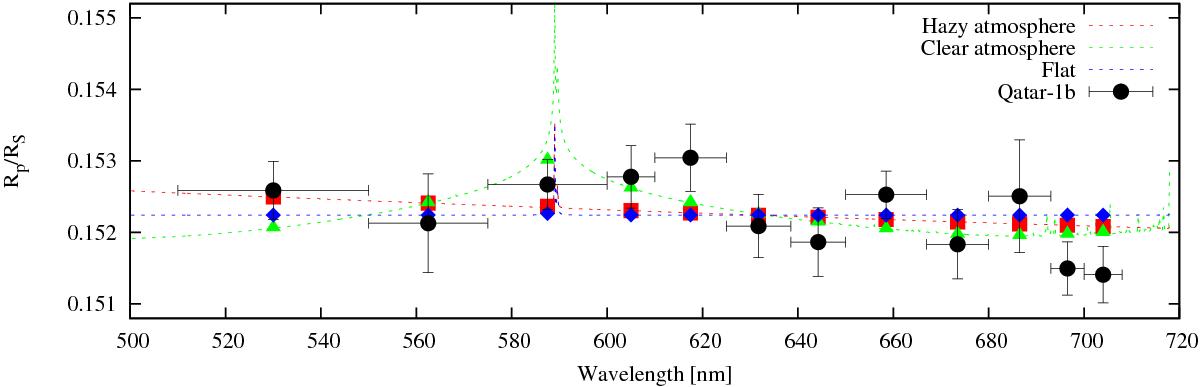
Transmission spectrum of Qatar-1b. Black circles and horizontal error bars show the derived RP/RS’s and their uncertainties. Horizontal lines are not error bars but indicate the size of the wavelength bin. Green, red and blue continuous lines correspond to Fortney et al. (2010) models for exo-atmospheres investigated in this work. Filled diamonds, squares and triangles indicate averages of the models within each wavelength bin. The models were artificially shifted to meet the data.
Current usage metrics show cumulative count of Article Views (full-text article views including HTML views, PDF and ePub downloads, according to the available data) and Abstracts Views on Vision4Press platform.
Data correspond to usage on the plateform after 2015. The current usage metrics is available 48-96 hours after online publication and is updated daily on week days.
Initial download of the metrics may take a while.