Free Access
Fig. 2
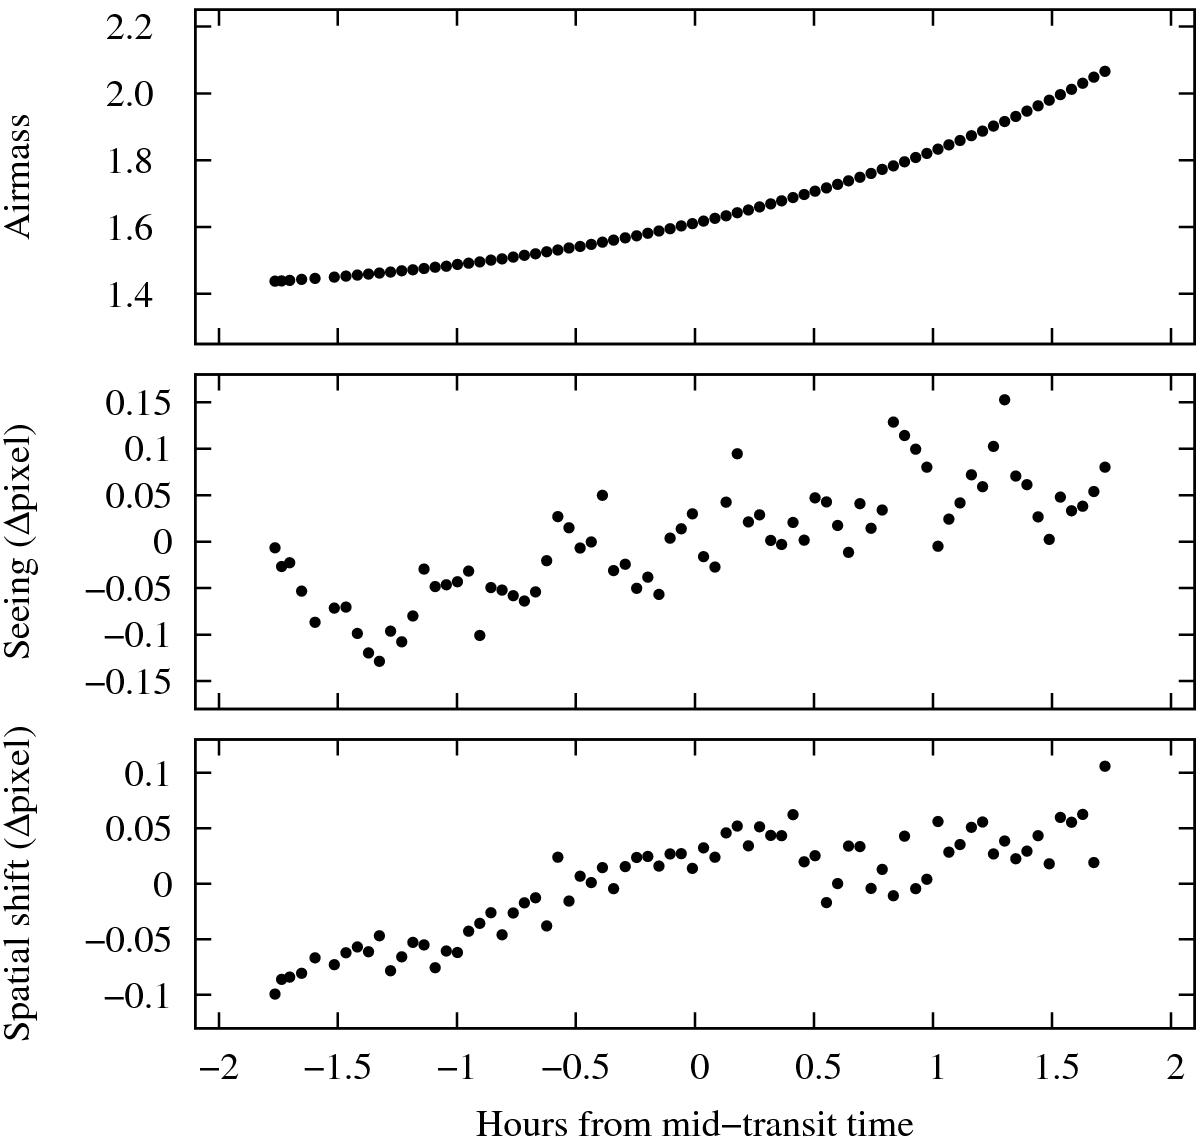
From top to bottom: air mass, seeing and spatial shift in binned pixels during observations of Qatar-1 as a function of the hours from mid-transit time. In the last two cases their mean value was subtracted to represent the variability as a function of time. The plot sizes were adjusted to display the same pixel scale.
Current usage metrics show cumulative count of Article Views (full-text article views including HTML views, PDF and ePub downloads, according to the available data) and Abstracts Views on Vision4Press platform.
Data correspond to usage on the plateform after 2015. The current usage metrics is available 48-96 hours after online publication and is updated daily on week days.
Initial download of the metrics may take a while.